Free data
Free CO₂ data and charts
Country emissions data to download, charts to reuse and a ready-made citation, for lessons, articles and research.
Download the data
Two CSV files, free to use under CC BY 4.0. They open in Excel, Google Sheets, R or Python.
Figures are annual CO₂ from fossil fuels and industry (cement and other processes), excluding land-use change, in million tonnes (Mt). Column notes are in the README. For the full dataset with more variables, go to the source: Our World in Data on GitHub.
Charts you can reuse
Each guide on this site opens with a chart of its key figures. You can use them in lessons, presentations and articles with a credit and a link to the guide. Tap a chart for the full-size image.
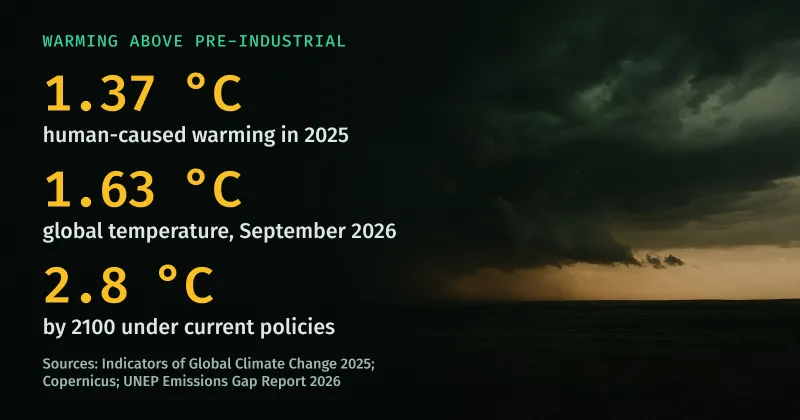 Climate outlook 2026: emissions, warming and what to watch · post
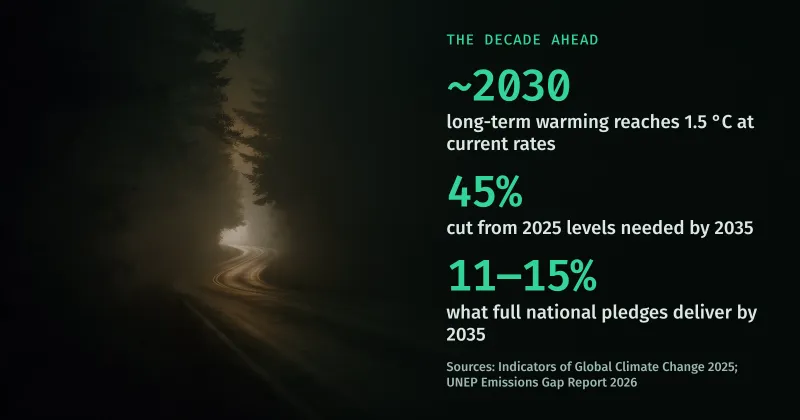 The next decade of climate change: 2025 to 2035 · post
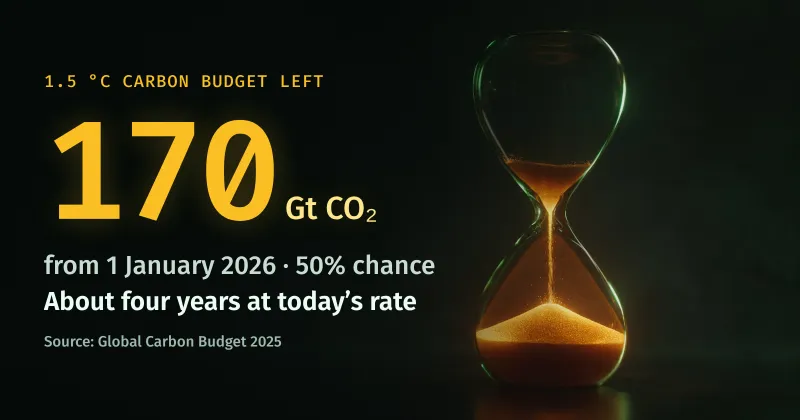 Remaining carbon budget for 1.5 °C: how much is left in 2026 · post
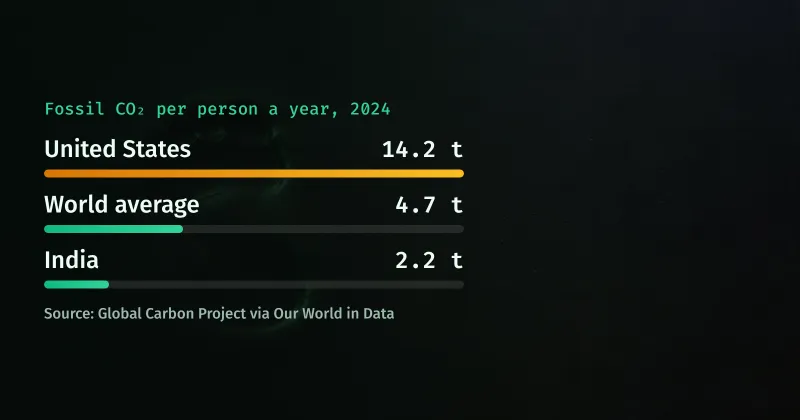 Carbon footprint calculator: estimate yours in 2 minutes · post
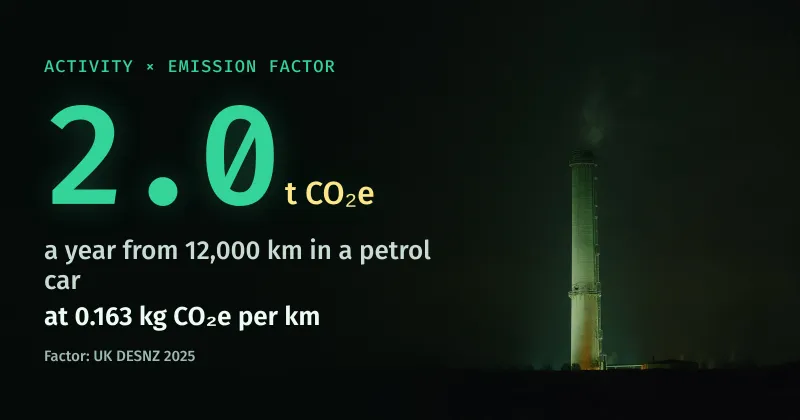 Carbon Tracking: How to Track Carbon Emissions (2026 Guide) · post
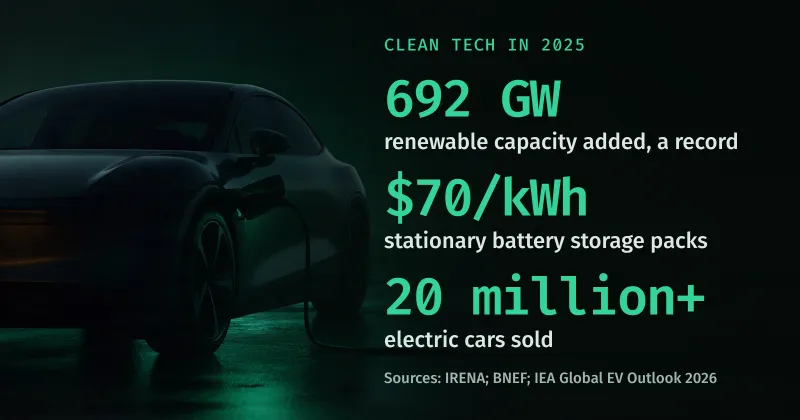 Climate technology in 2026: what’s working and what’s hype · post
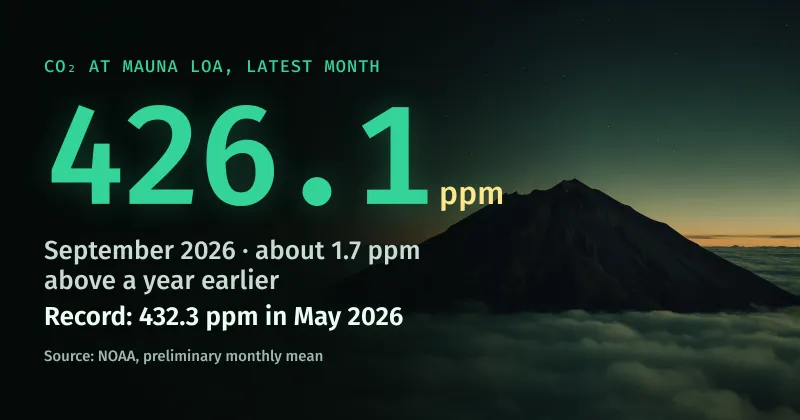 CO₂ ppm today: current level and why it keeps rising · post
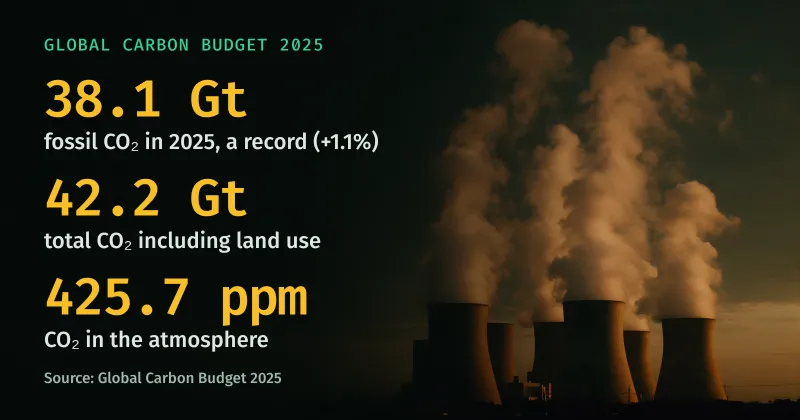 Global Carbon Budget 2025: key findings explained · post
 Eco-friendly family activities: 20 ideas kids actually enjoy · post
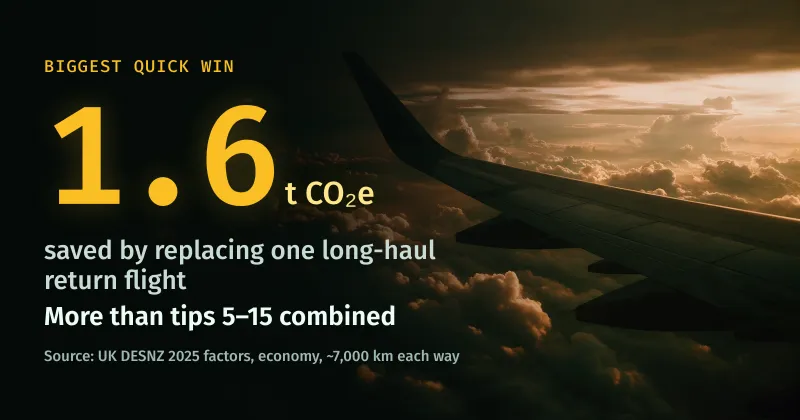 15 quick ways to reduce your carbon footprint, ranked · post
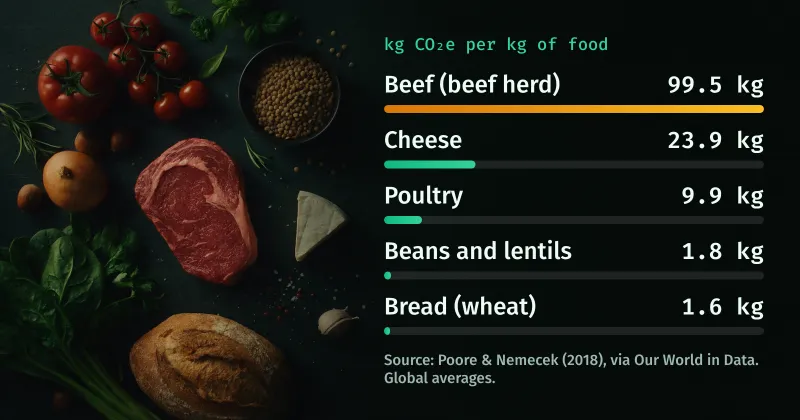 Carbon footprint of food: what matters and what doesn’t · post
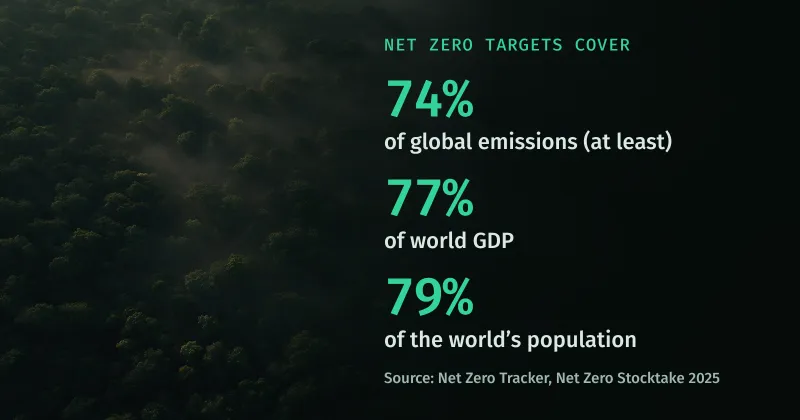 Net zero explained: what it means and how far the world is · post
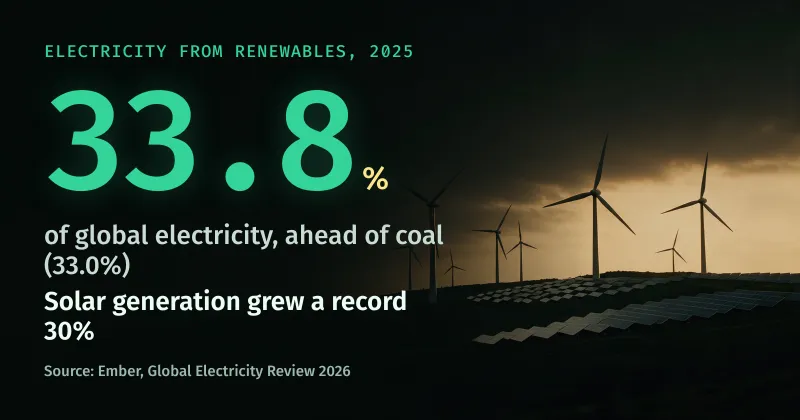 Renewable energy in 2026: global progress and home options · post
 How to save energy at home: 15 ways to cut bills and CO₂ · post
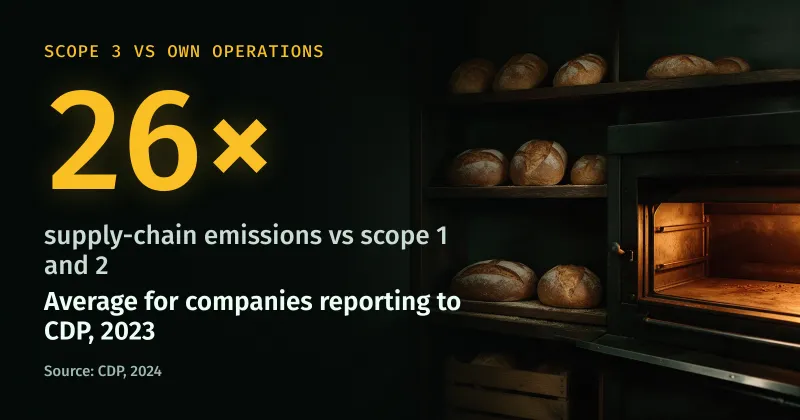 Scope 1, 2 and 3 emissions explained, with examples · post
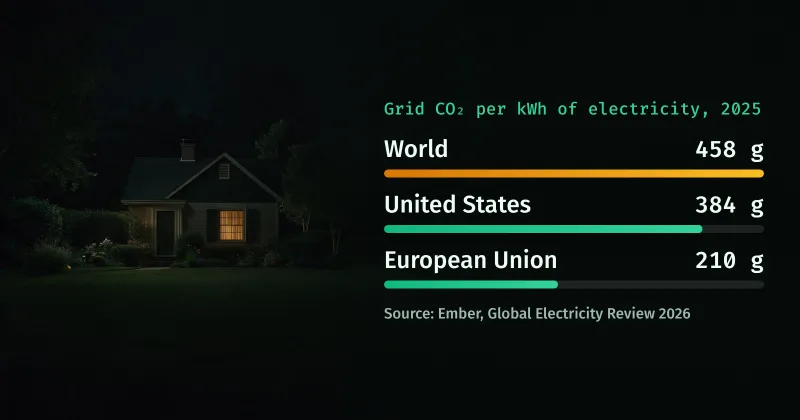 How to track your home energy use: meters, monitors and apps · post
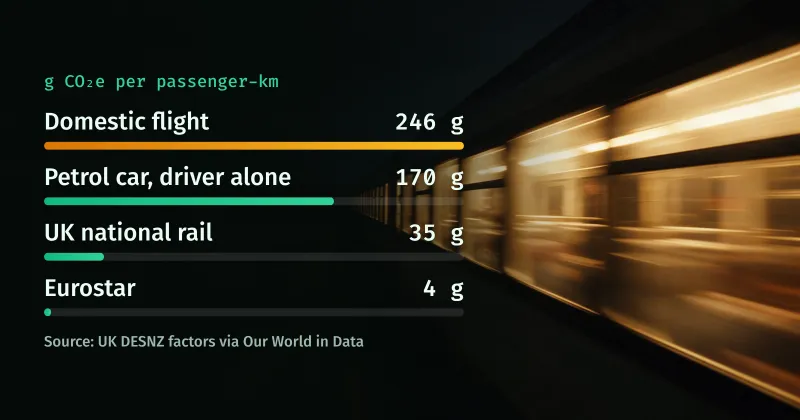 Transport emissions compared: cars, EVs, trains and planes · post
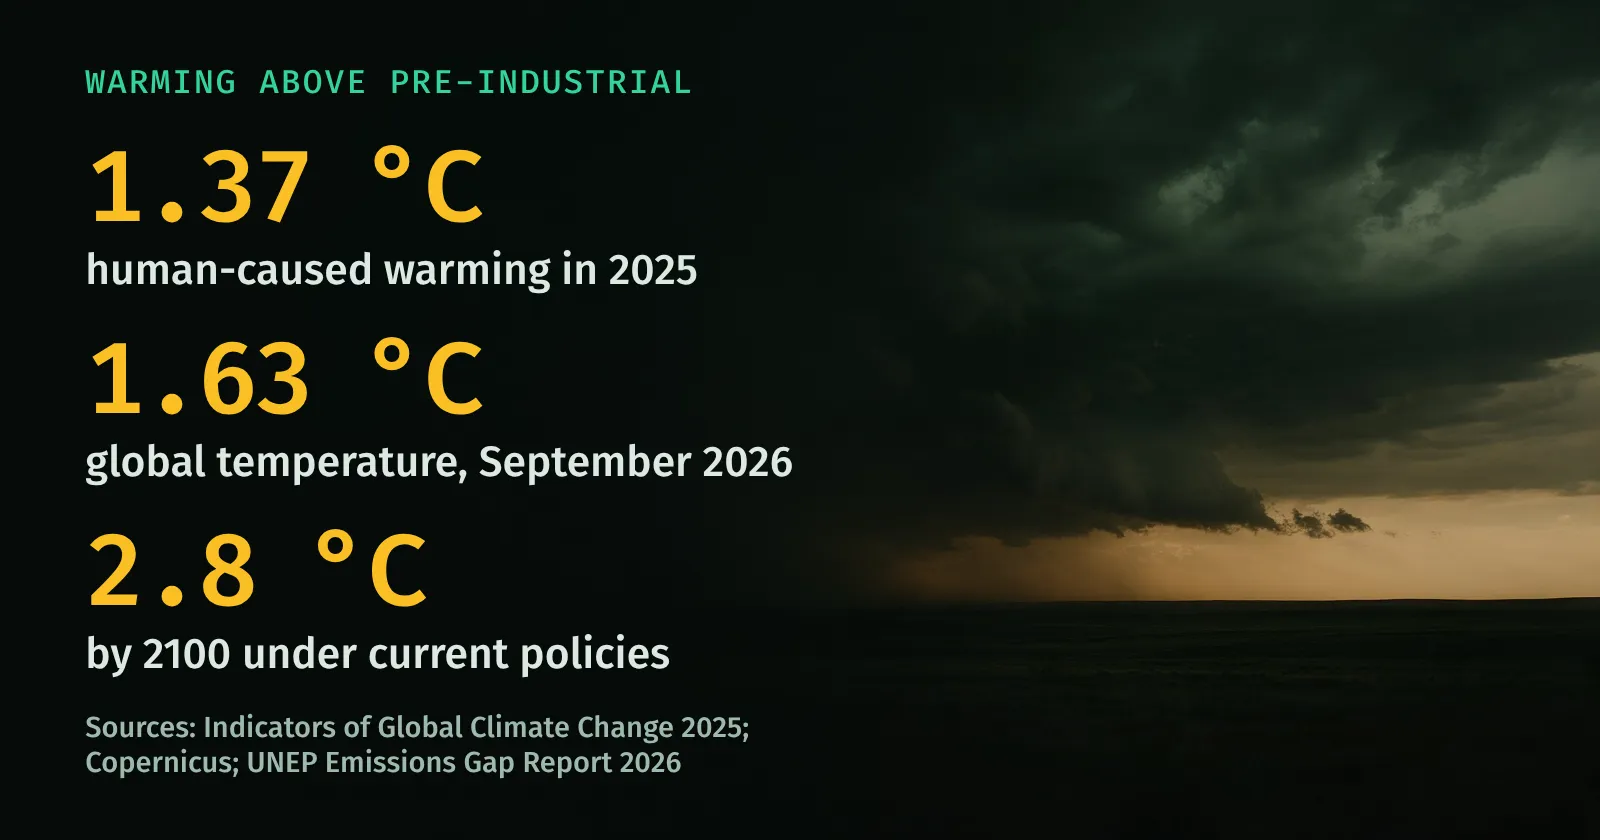
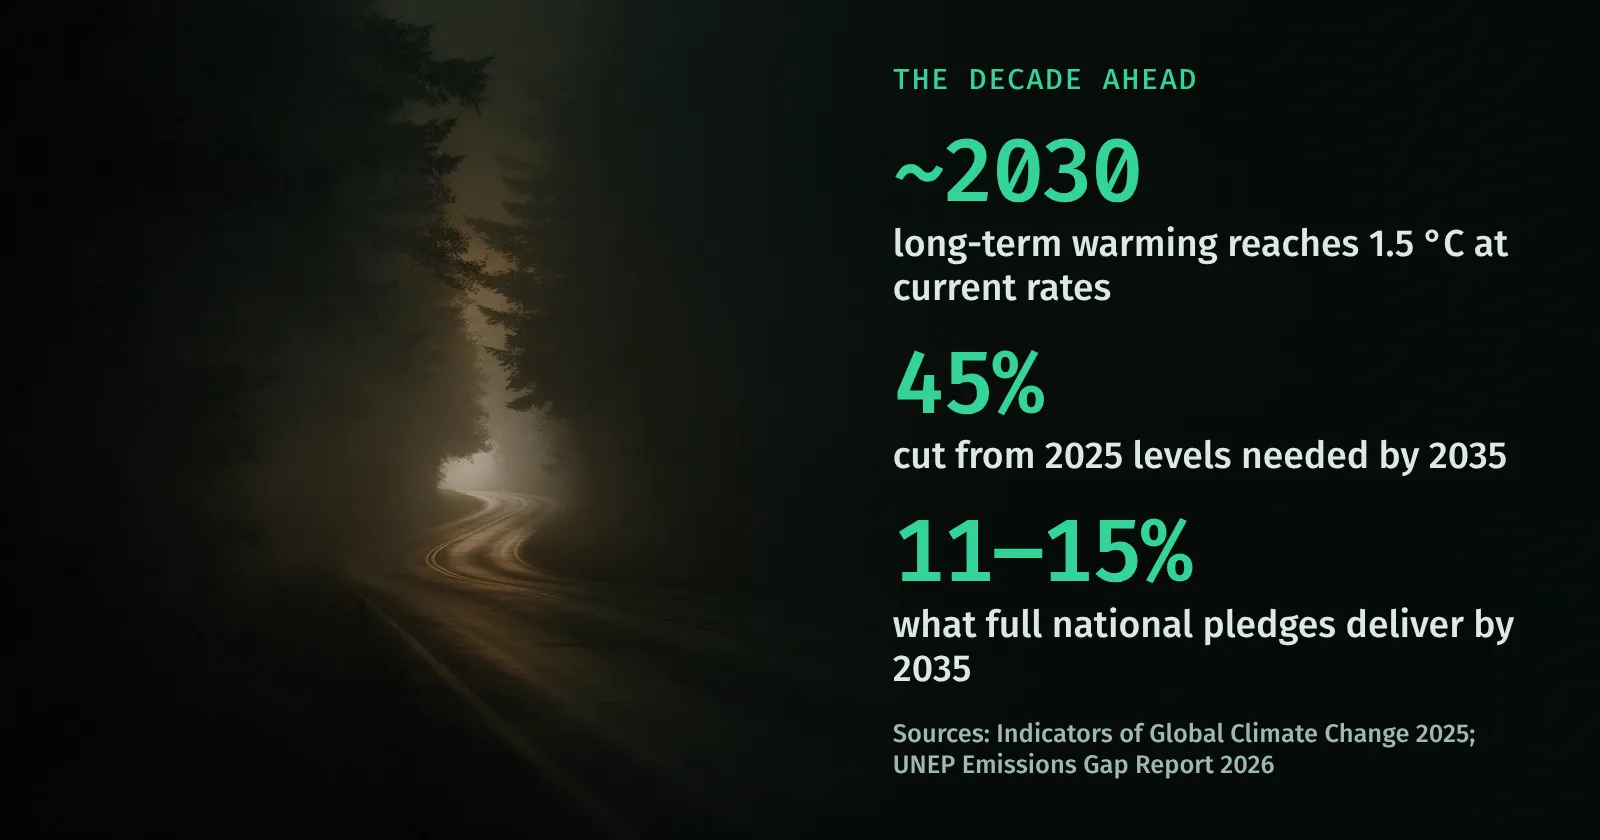
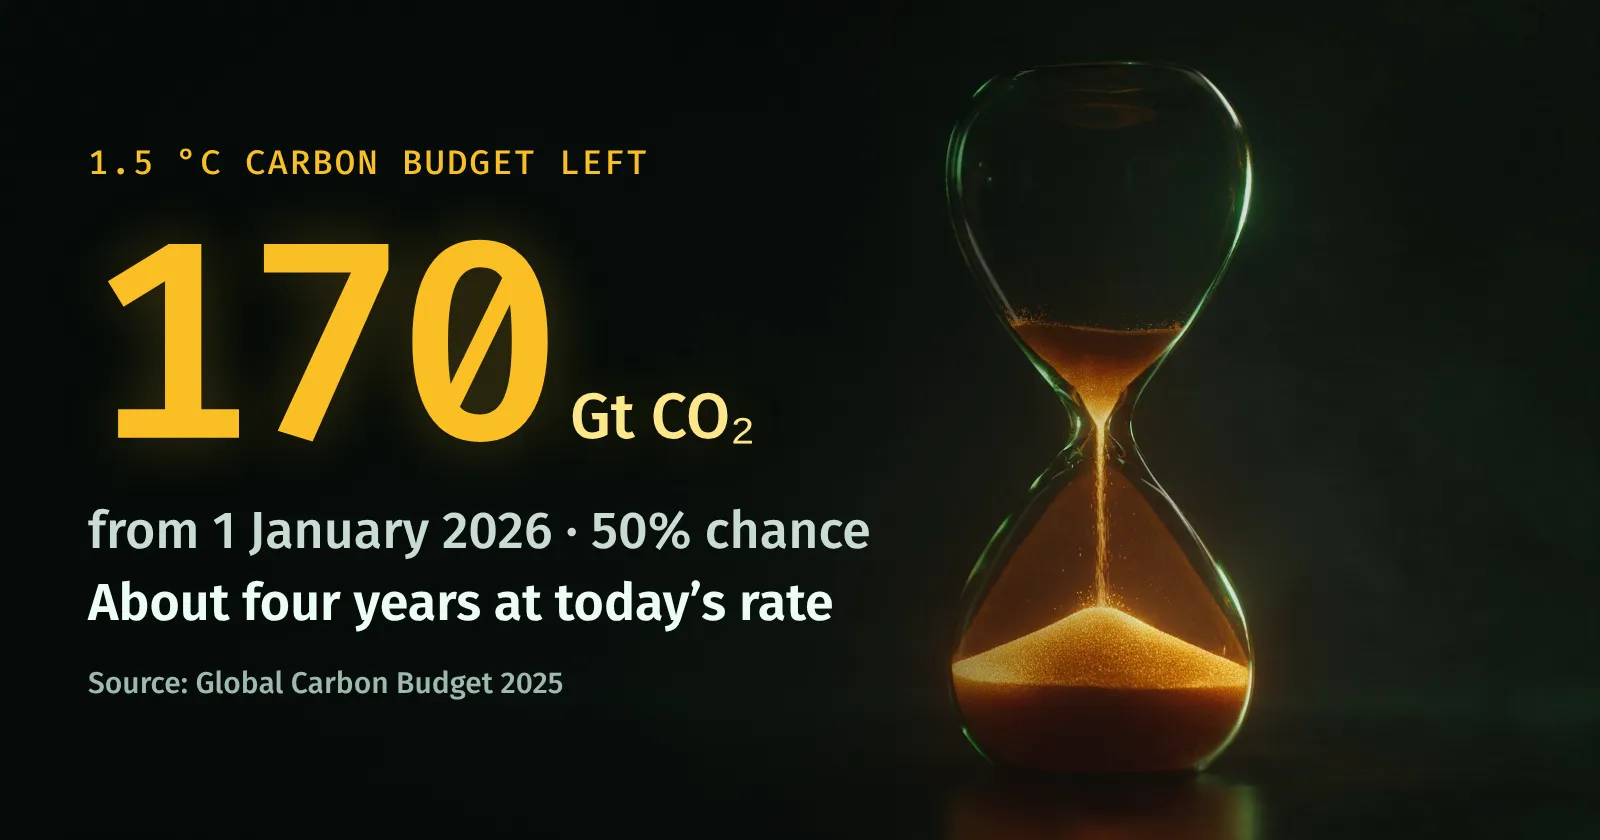
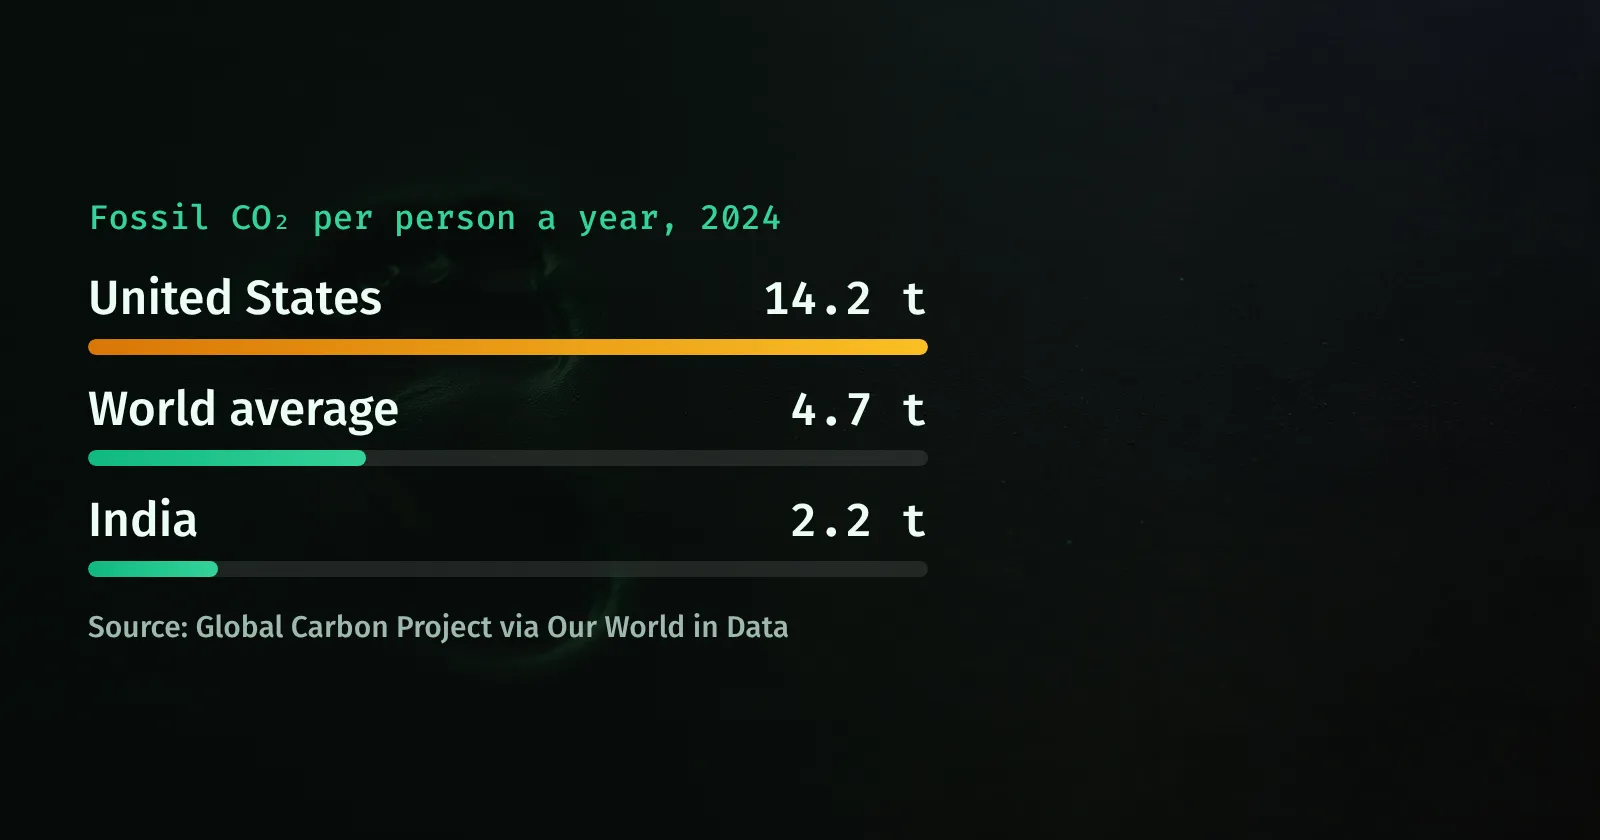
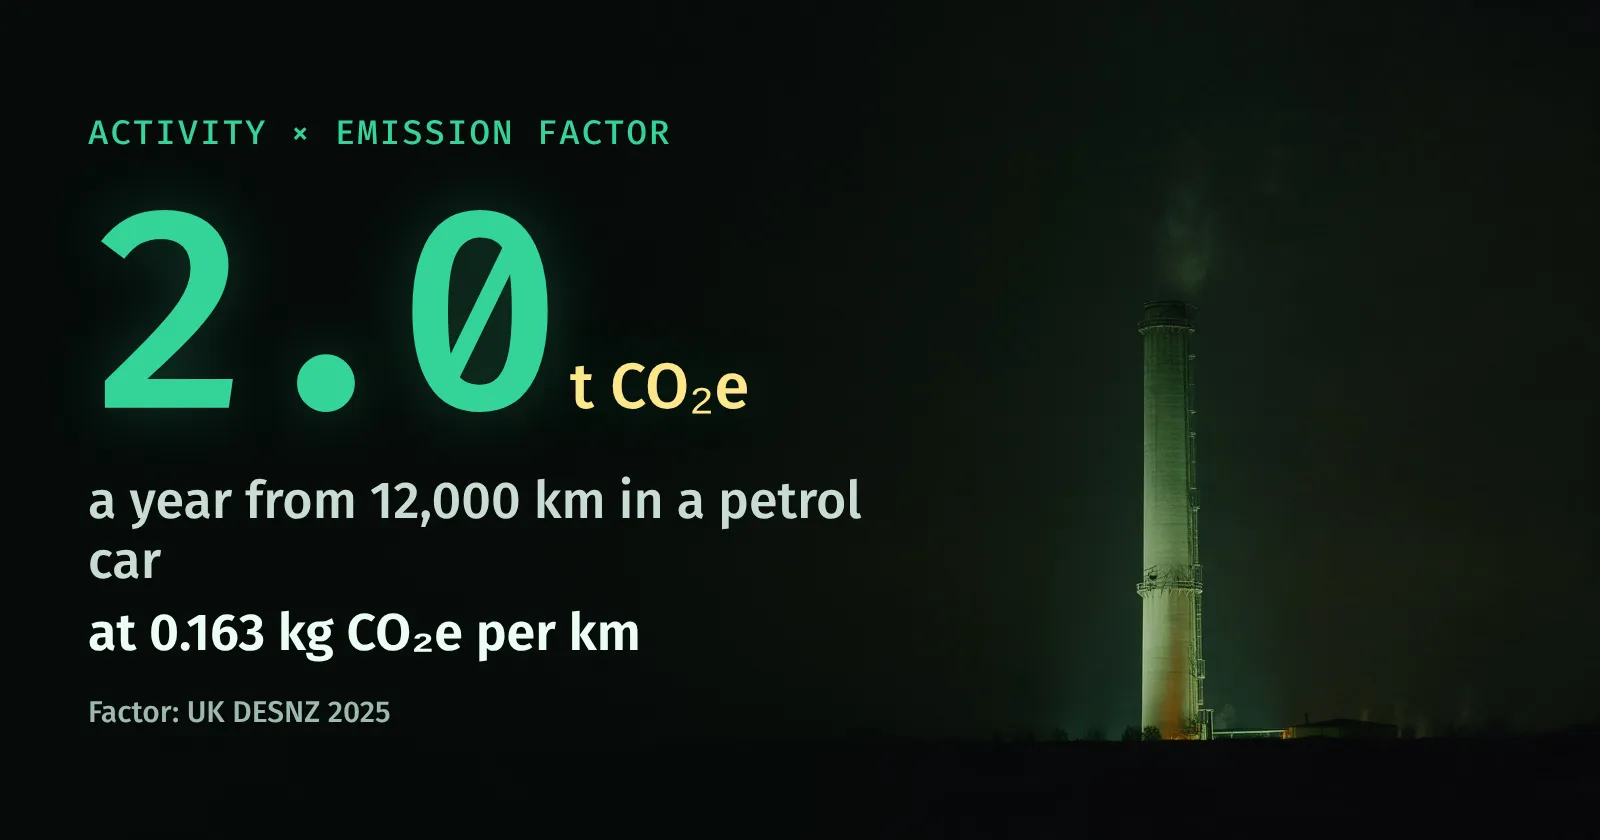
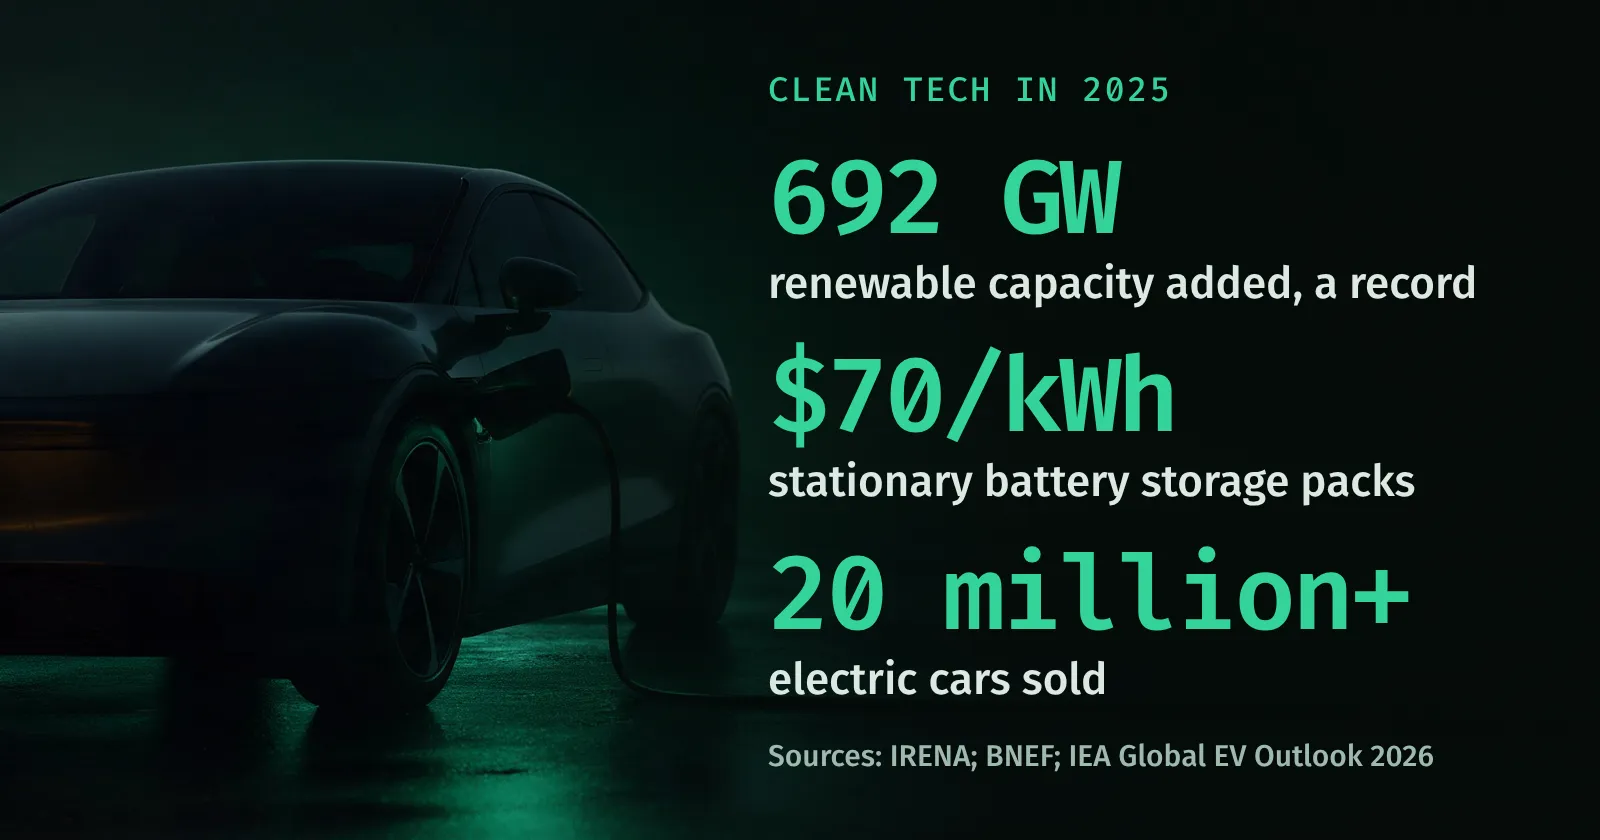
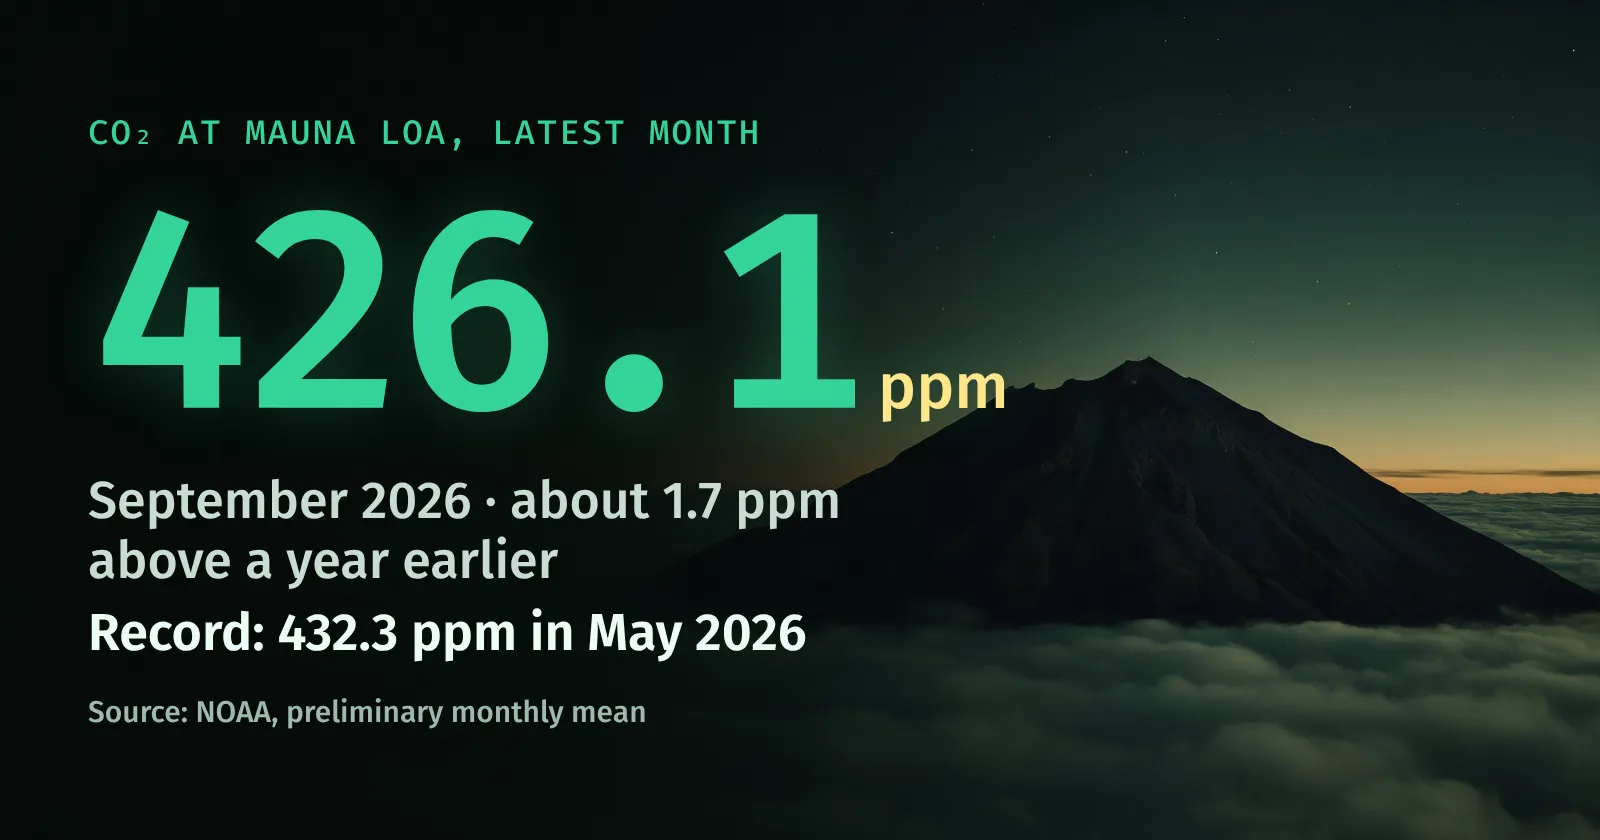
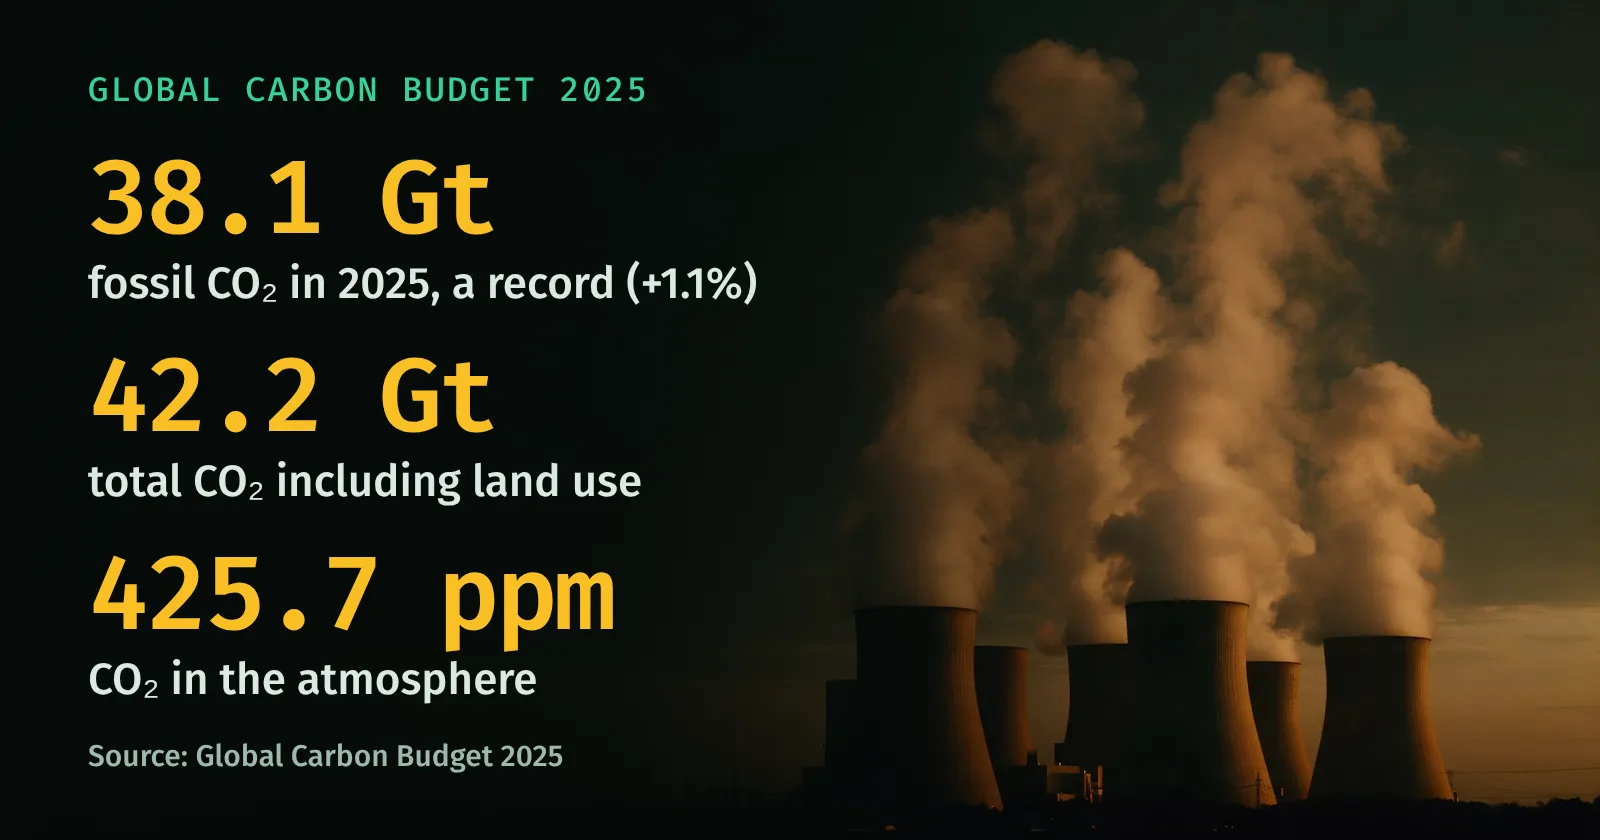

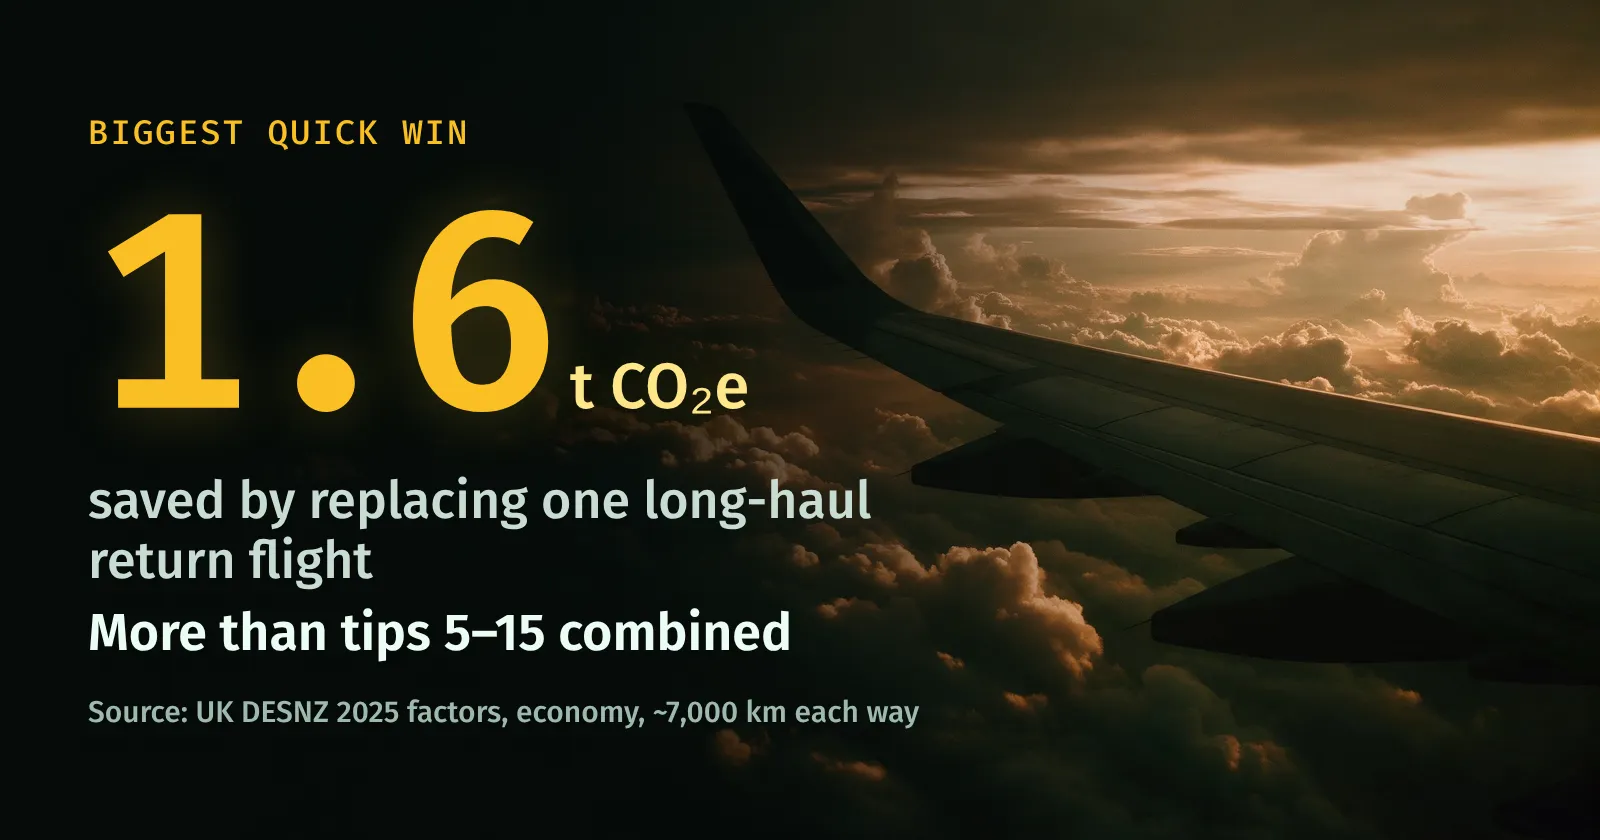
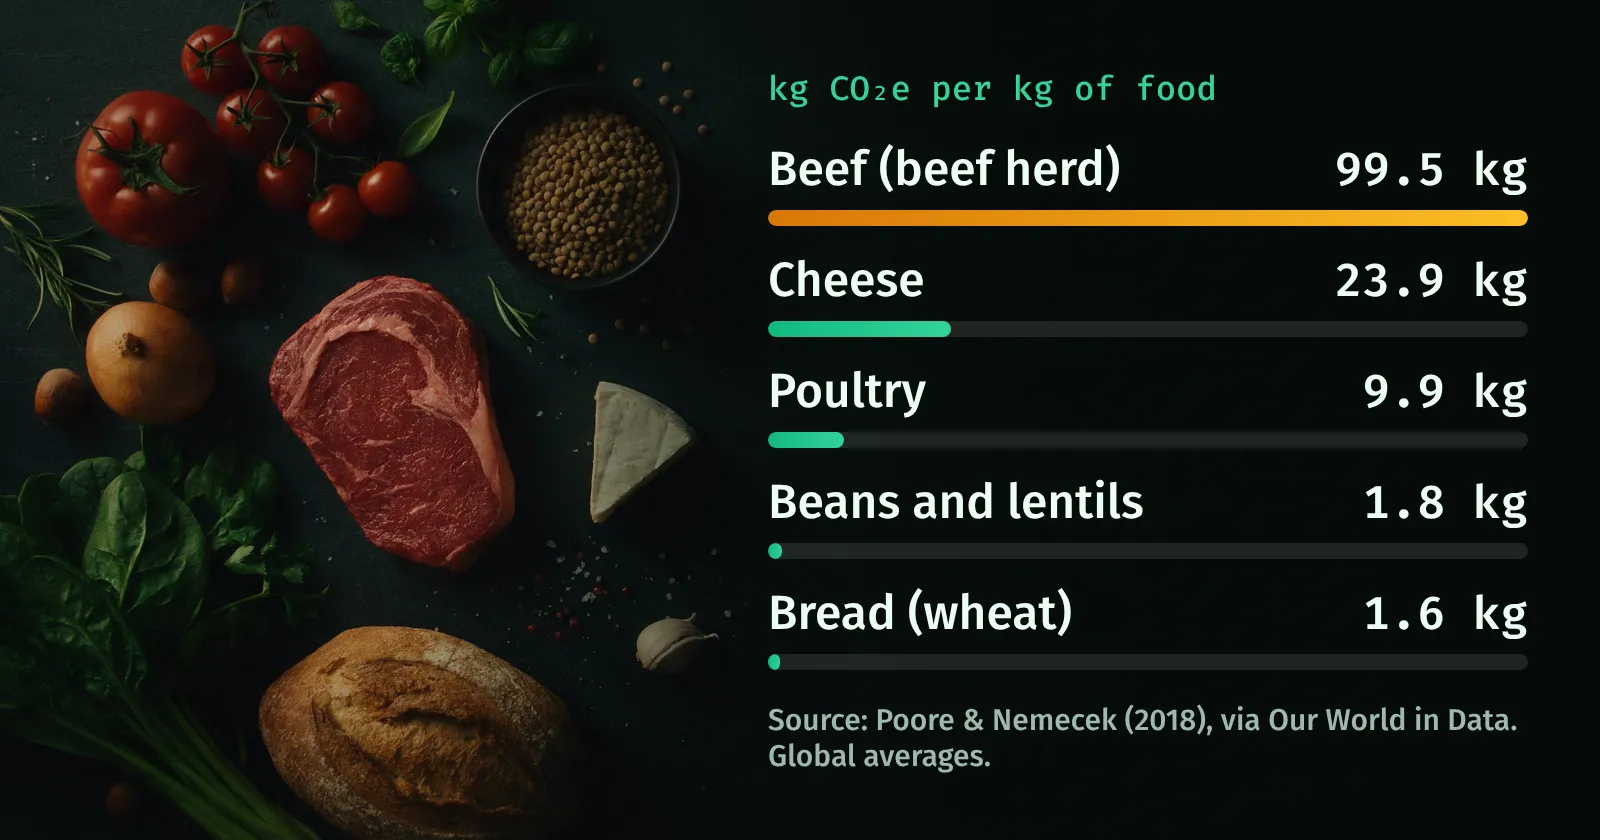
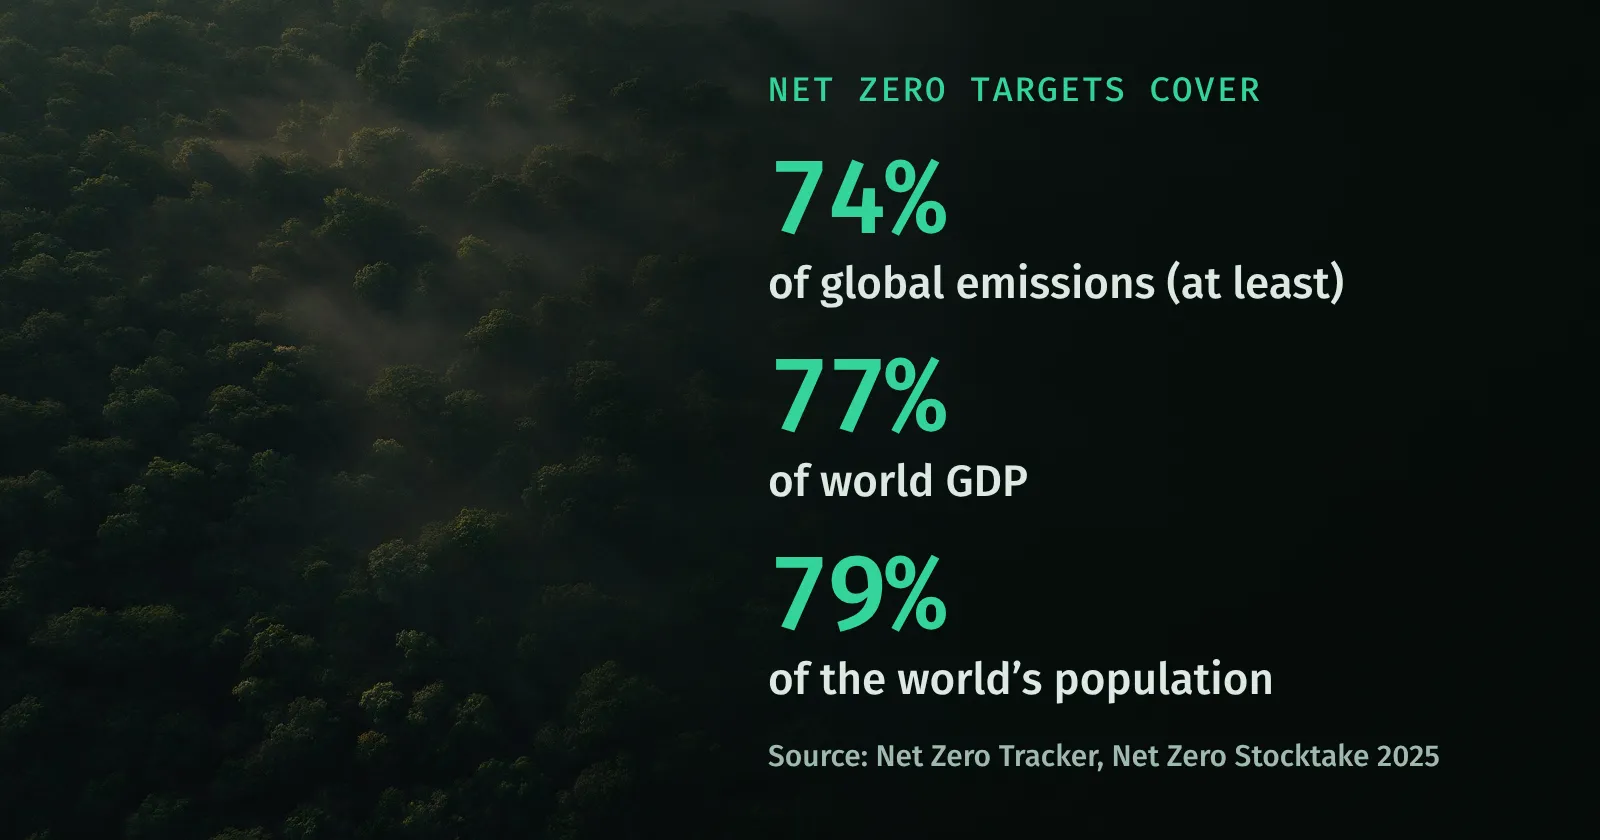
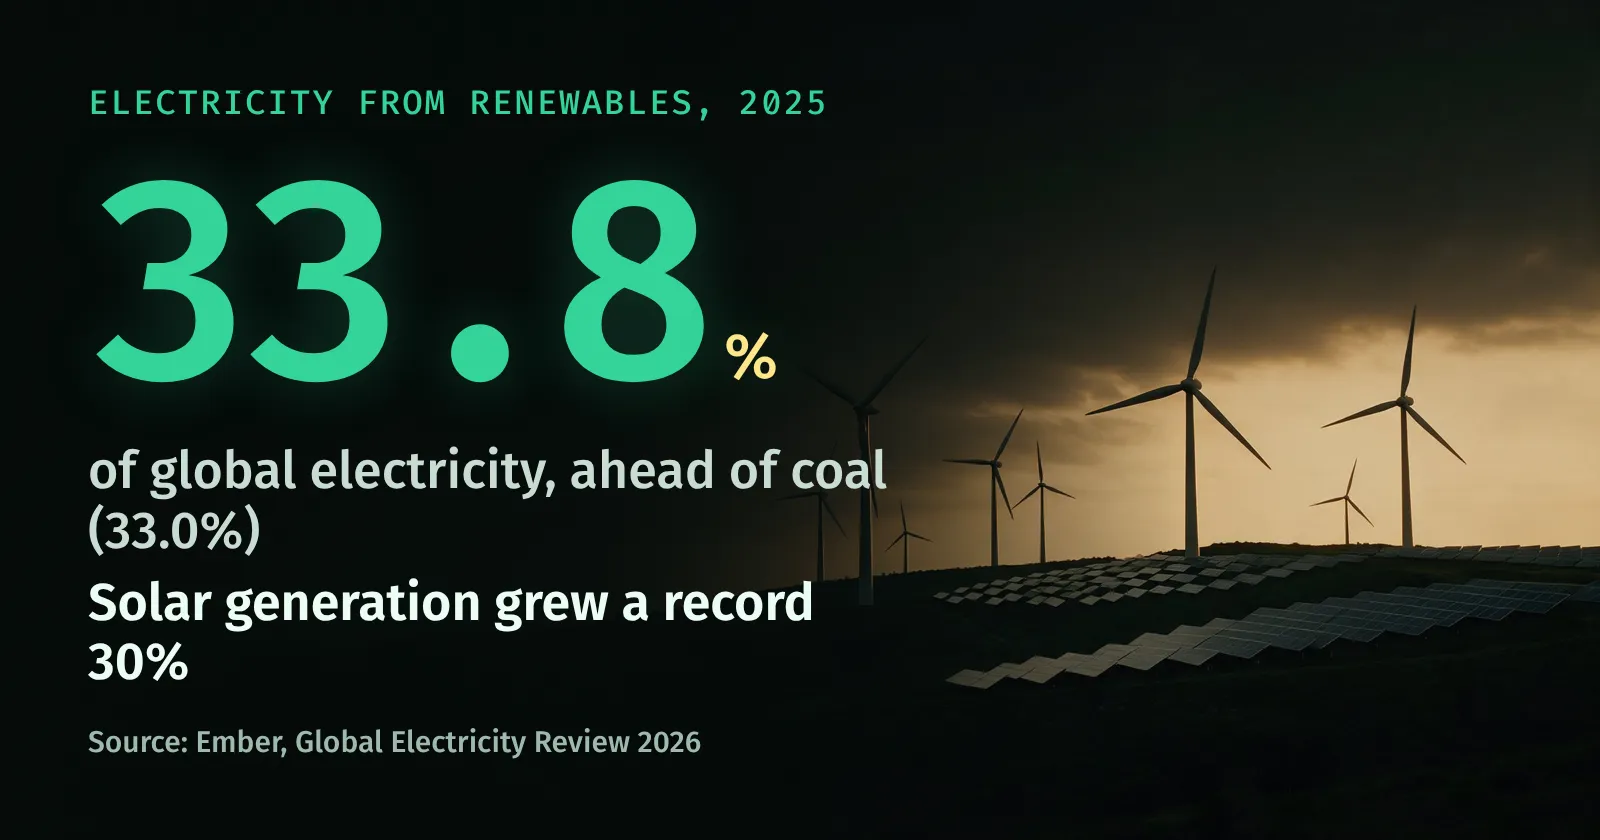

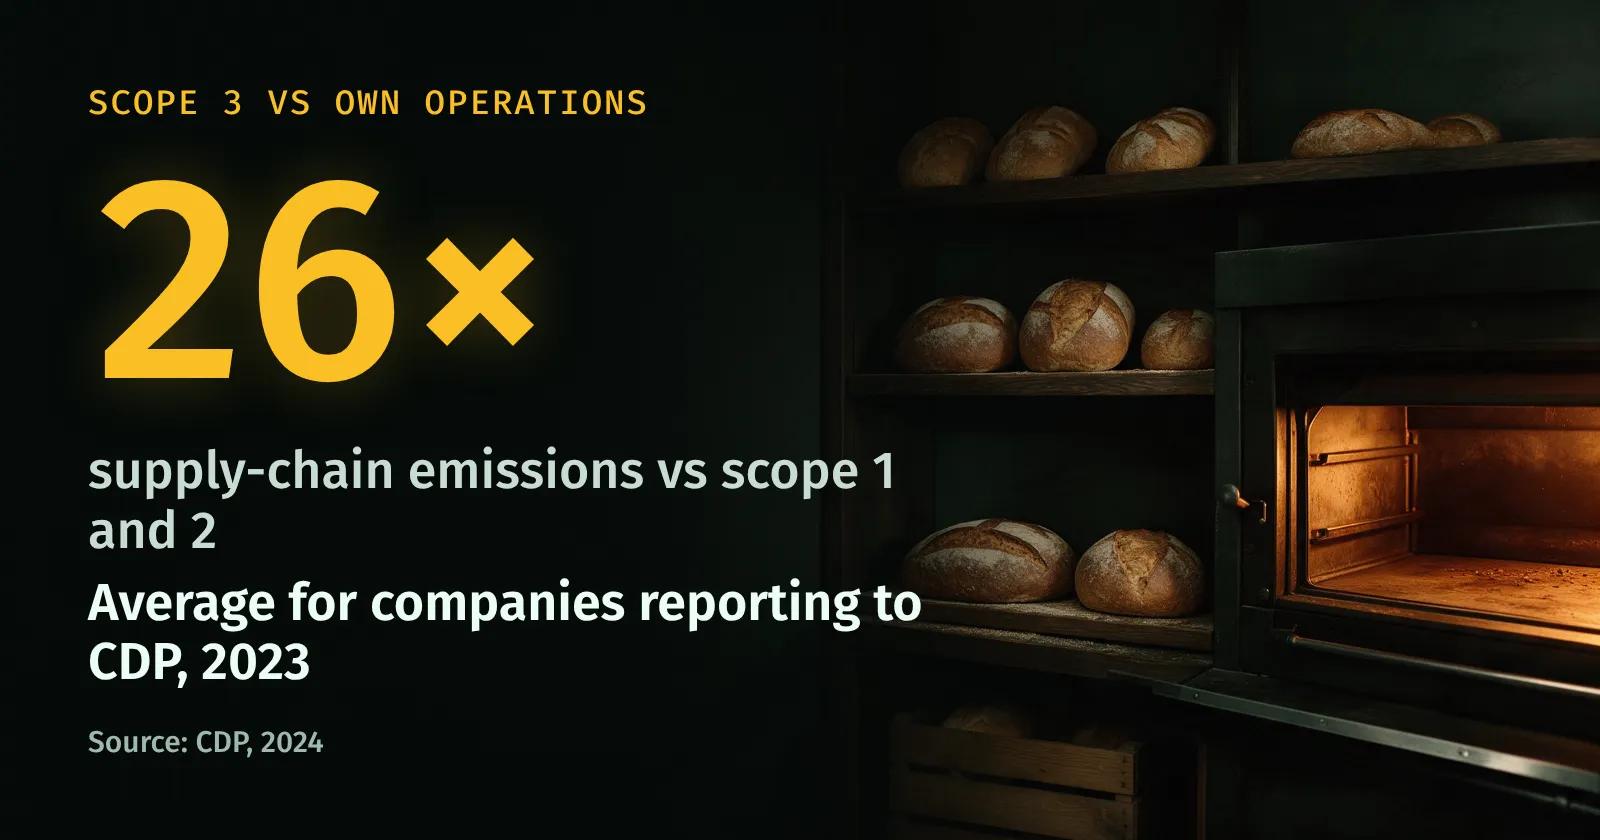
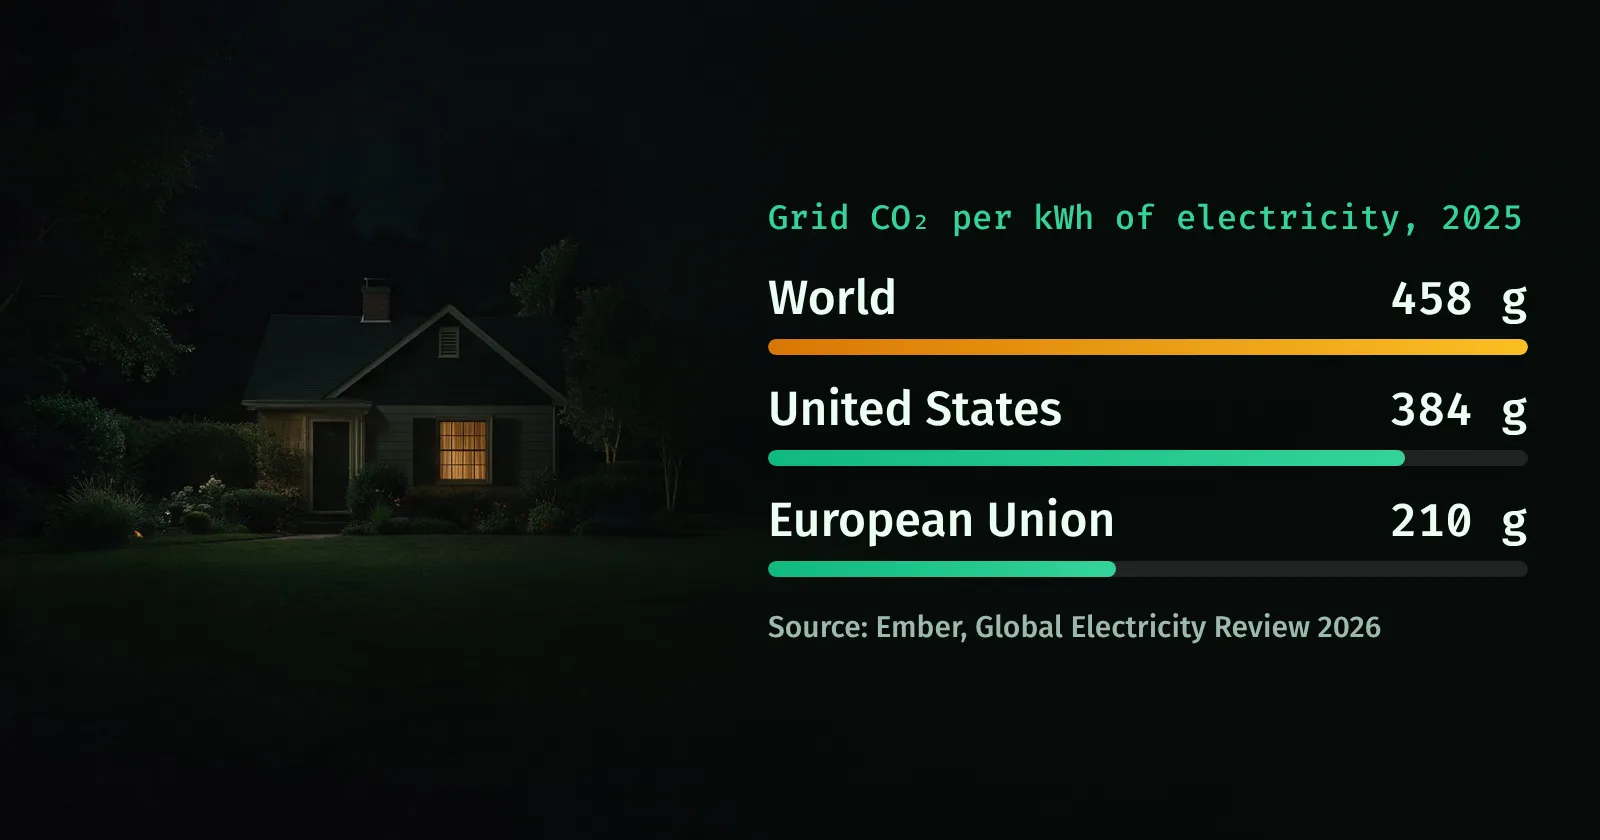
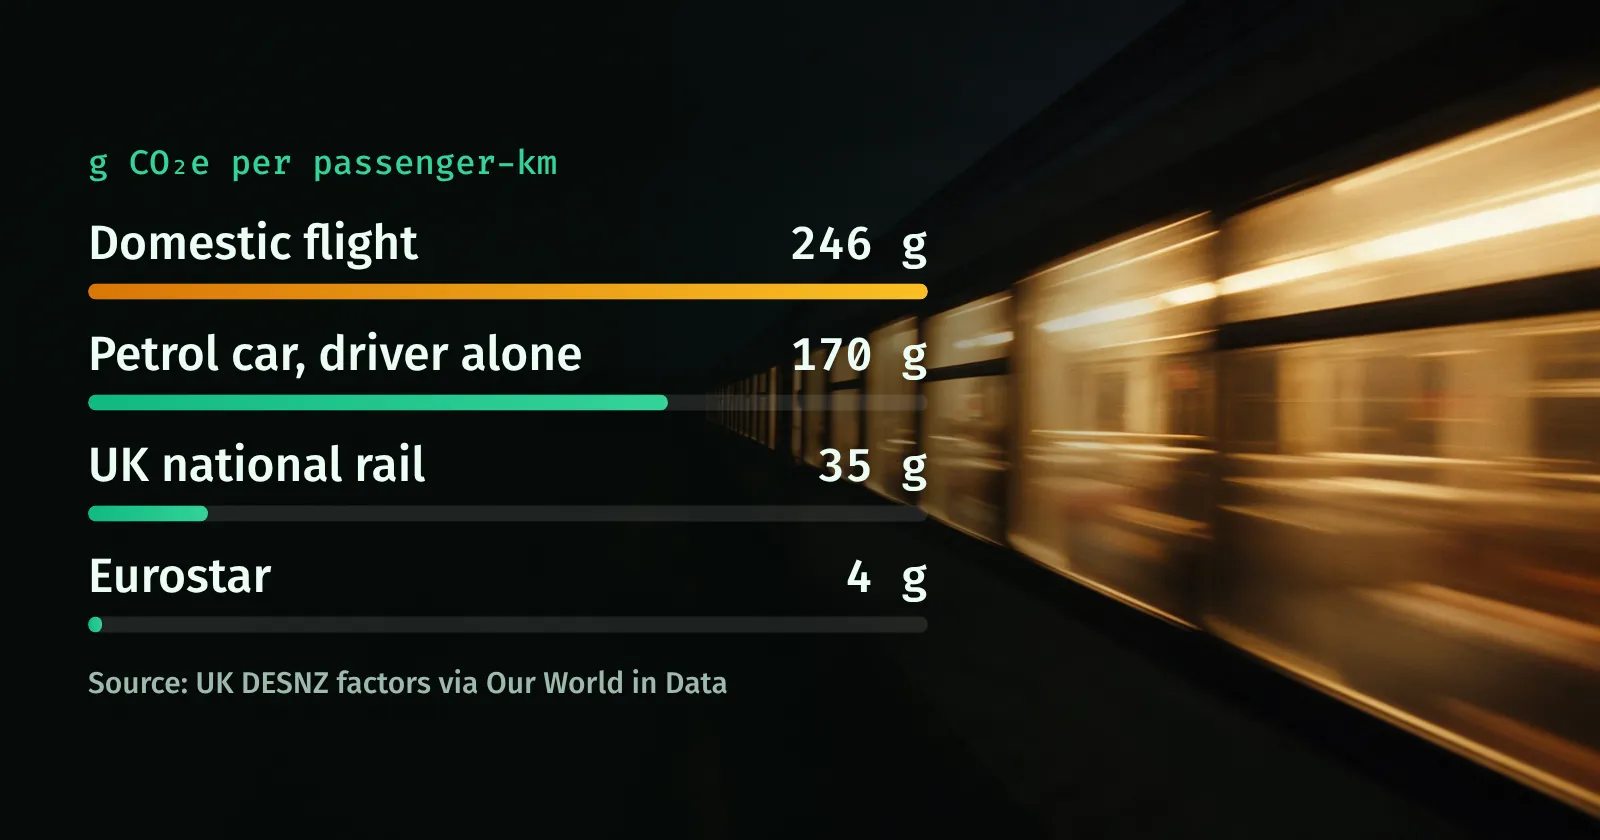
The photos behind the charts are illustrations; every number comes from the sources listed in the guide.
How to cite this site
Carbon Emissions Counter (2026). CO₂ emissions by country, 2024 data. Based on Our World in Data and the Global Carbon Budget 2025. https://www.carbonemissionscounter.com/data
For the live global counter, cite the home page; for one country, cite its page, for example China.
Put the live counter on your site
Show global CO₂ emissions rising, or the 1.5 °C carbon budget running out, with one line of code. It’s free, sets no cookies and works on phones. Get the widget.
Licence and sources
- Data: Our World in Data based on the Global Carbon Project (Global Carbon Budget 2025), CC BY 4.0. Please credit “Our World in Data and the Global Carbon Project, via Carbon Emissions Counter” with a link to this page.
- Charts and text: free to reuse with a credit and a link, as set out in the terms of use.
- How the numbers work: see how the counter works. Spotted a problem? Tell us.