By country
0
tonnes of fossil CO₂ so far in 2026
31.8% of global fossil CO₂ · 12.29 Gt a year
China CO₂ profile →Live estimate · updates every second
A live CO₂ tracker for the whole planet: global emissions from fossil fuels and land use, counted in real time from the Global Carbon Budget 2025.
CO₂ emitted worldwide in 2026
0
tonnes since 1 January
CO₂ the world can still emit for a 50% chance of keeping warming to 1.5 °C.
170.00Gt CO₂ left
Runs out in
at today’s rate of 42.2 Gt a year
Fossil fuels and industry, billion tonnes a year
Annual emissions are about 6.5× higher than in 1950. Recessions caused brief dips, but no lasting decline yet. Which countries emitted the most →Country-level series from Our World in Data; the Global Carbon Budget’s headline estimate for 2025 (38.1 Gt) uses slightly different accounting.
Your lifetime
Enter your birth year to see how much of all the fossil CO₂ ever released happened in your lifetime.
58%of all fossil CO₂ ever emitted has been released since 1990.
Fossil fuels and industry, 1750–2024. Source: Our World in Data, based on the Global Carbon Project.
0
tonnes of fossil CO₂ so far in 2026
31.8% of global fossil CO₂ · 12.29 Gt a year
China CO₂ profile →2025 estimates from the Global Carbon Budget. Fossil emissions reached a record high, up 1.1% on 2024.
Share of global fossil CO₂, 2024 data. Full ranking of all countries →
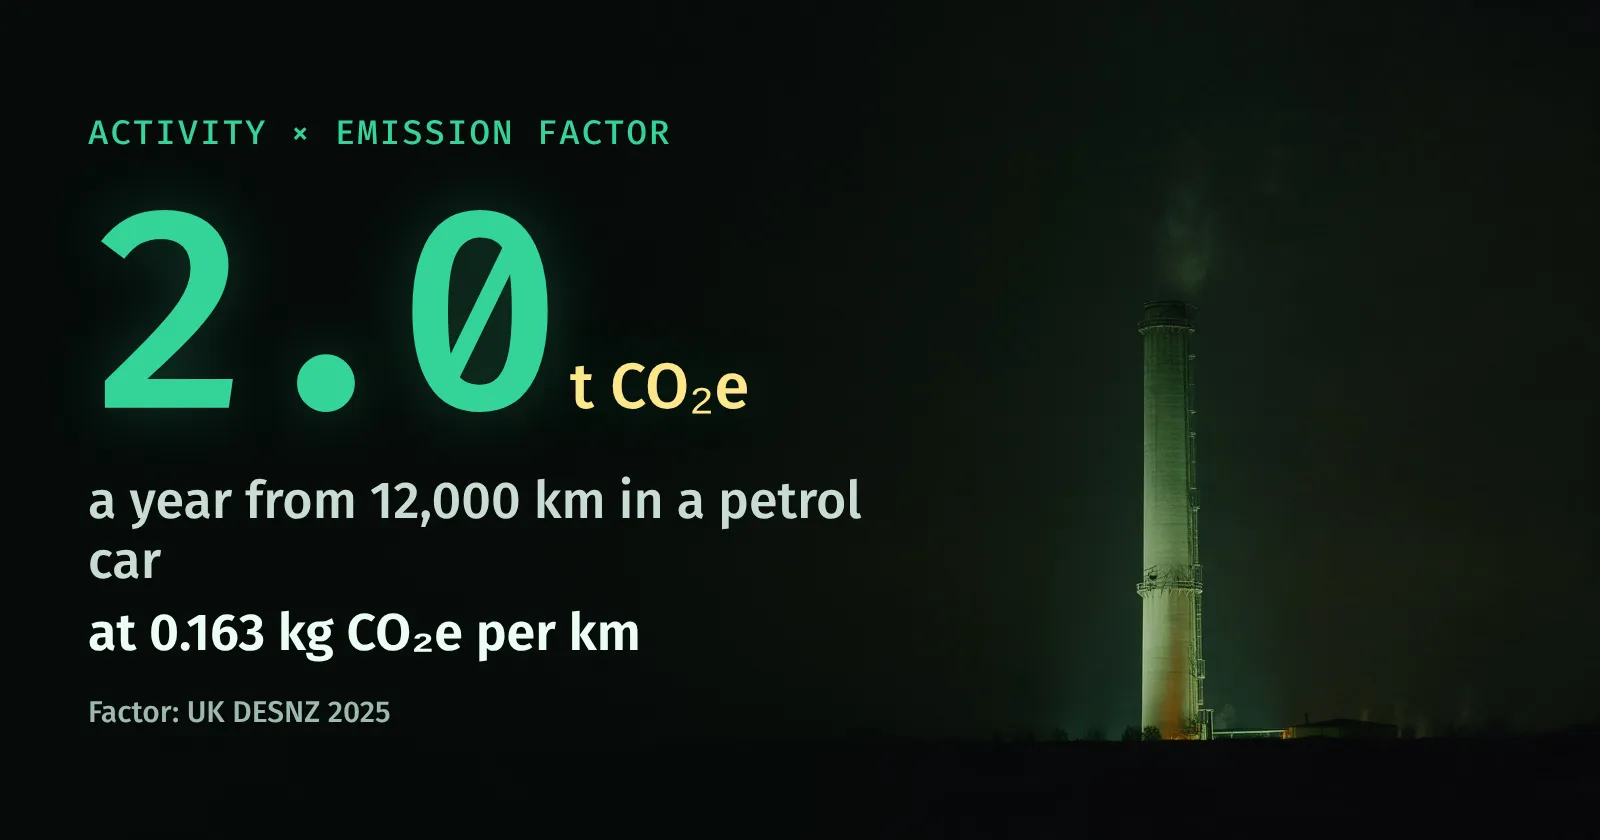
Car and flight factors: UK government (DESNZ) 2025, flights including contrail effects. Phone charges: US EPA.
Estimates are calculated from annual totals in the Global Carbon Budget 2025, not measured live. How the counter works →
Free carbon footprint calculator with sourced 2025 emission factors. See your tonnes of CO₂e by category, how you compare and your three biggest cuts.
What carbon tracking is and how to do it: track your own footprint, measure company emissions across scopes 1, 2 and 3, and what real-time carbon tracking can and can’t show.
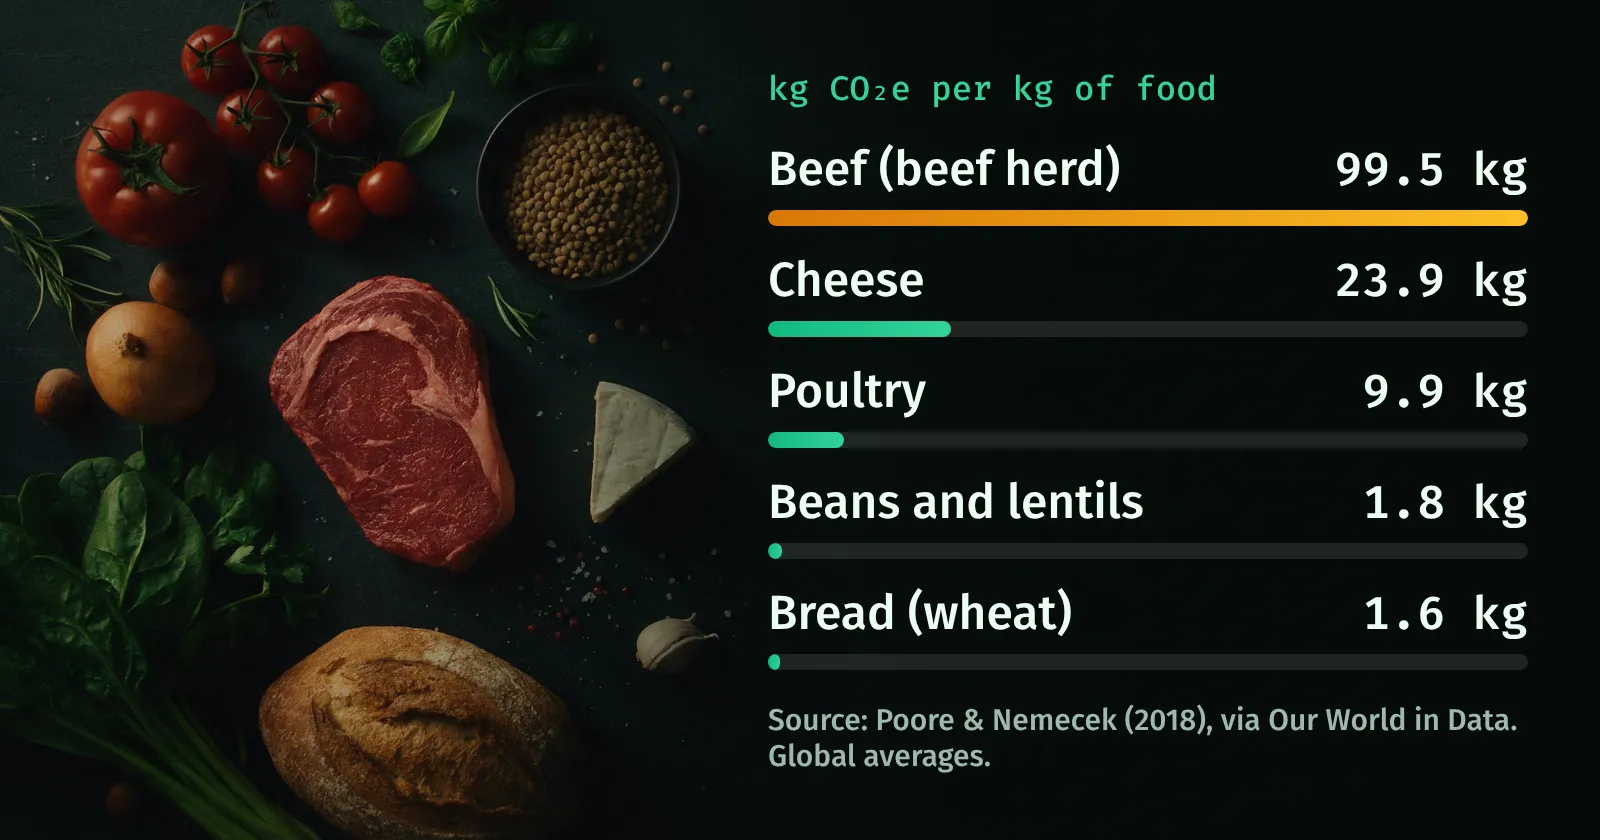
Food emissions per kg and per 100 g protein for 20 foods, how much diet changes cut, why local matters less than you think, and swaps with rough savings.
About 42.2 billion tonnes of CO₂ a year (Global Carbon Budget 2025): 38.1 billion tonnes from fossil fuels and cement, a record high, plus 4.1 billion tonnes from land-use change such as deforestation. That works out to roughly 1,338 tonnes every second, or 4.7 tonnes of fossil CO₂ per person.
About 1,338 tonnes every second, 80,300 tonnes a minute, 4.8 million tonnes an hour and 115.6 million tonnes a day. These figures spread the 2025 annual total of 42.2 billion tonnes evenly across the year.
About 425.7 parts per million (ppm) on average in 2025, according to the Global Carbon Budget, 52% above the pre-industrial level of about 280 ppm. The level is rising by roughly 2–3 ppm a year and is higher than at any time in at least 2 million years. Today’s CO₂ level in detail.
Human-caused warming reached an estimated 1.37 °C above the 1850–1900 average in 2025 (Indicators of Global Climate Change). 2024 was the warmest year on record and the first calendar year above 1.5 °C, but the Paris Agreement limit refers to a 20-year average, so it has not been formally crossed yet.
The Global Carbon Budget 2025 puts the remaining budget for a 50% chance of 1.5 °C at 170 billion tonnes of CO₂ from the start of 2026: about four years at today’s emissions, so around early 2030. Another assessment (Indicators of Global Climate Change 2025) estimates 130 billion tonnes, closer to three years. The carbon budget explained.
China emits the most CO₂: 12.29 billion tonnes in 2024, 31.8% of the world total. The United States (4.90 billion tonnes) and India (3.19 billion tonnes) follow, and together the top three produce 53% of global fossil CO₂. See the full ranking of 213 countries.
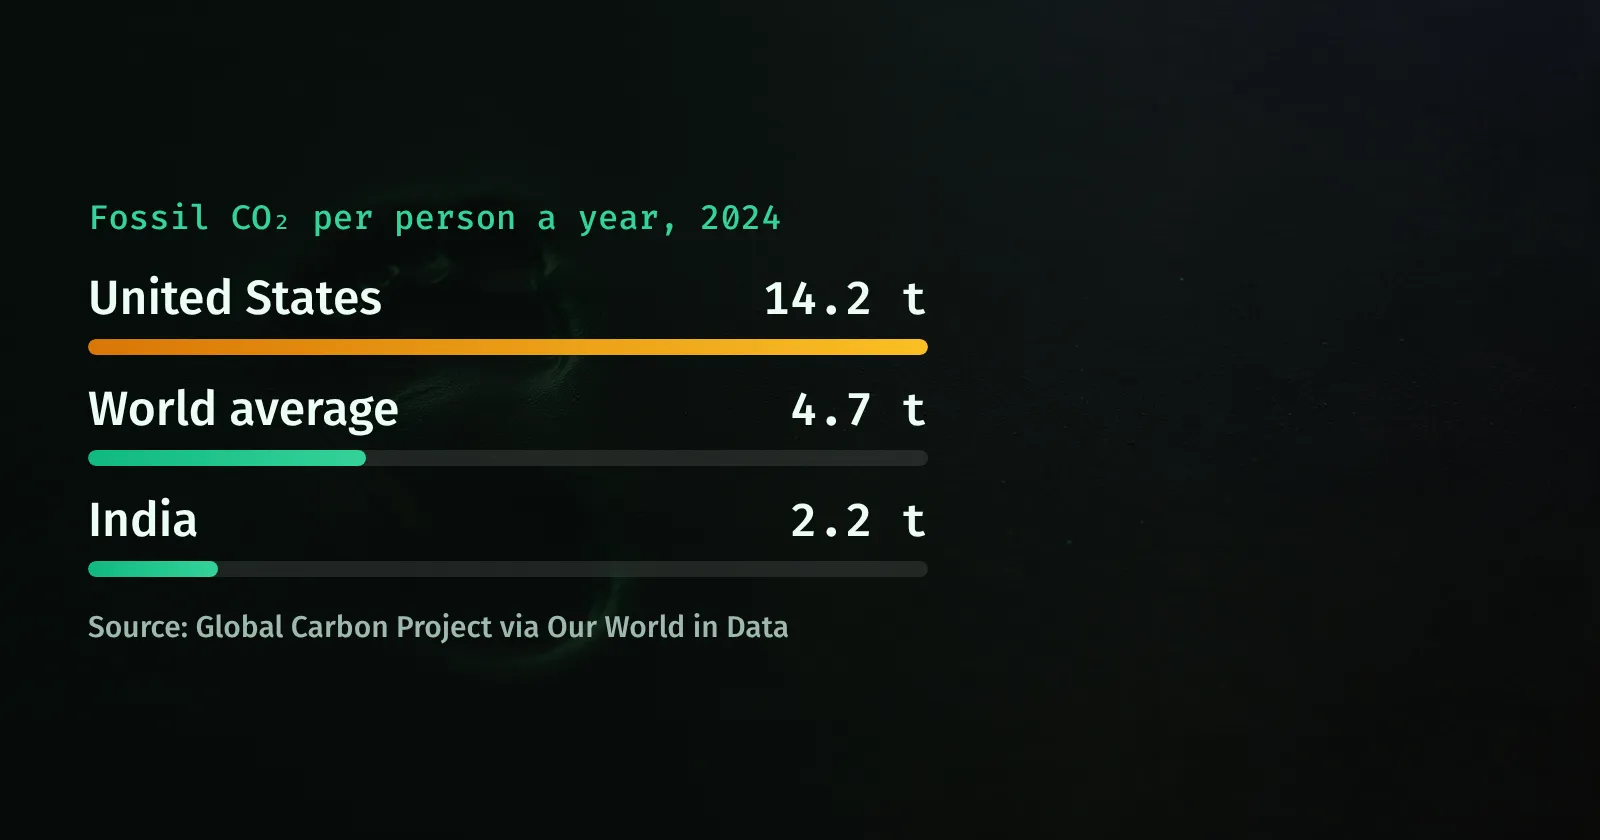
Among countries with more than one million people, Qatar has the highest emissions per person at 41.3 tonnes a year, followed by Kuwait (26.2 t) and Bahrain (24.3 t). The world average is 4.7 tonnes; in the United States it is 14.2 t, in China 8.7 t and in India 2.2 t.
Since 1750, the United States has emitted the most fossil CO₂ (23.5% of the total), followed by China (15.4%) and Russia (6.6%). Historical totals matter because CO₂ stays in the atmosphere for centuries.
Burning fossil fuels: coal (41% of fossil CO₂ in 2024), oil (32%) and gas (21%), plus cement production (4%). By sector, electricity and heat are the biggest source, followed by industry and transport. Deforestation and other land-use change add about 4 billion tonnes a year.
CO₂ lets sunlight in but absorbs heat radiated by the Earth, so more of it warms the planet. Much of it stays in the atmosphere for centuries, which is why warming tracks total cumulative emissions: every 1,000 billion tonnes of CO₂ adds roughly 0.45 °C (IPCC).
A common unit for all greenhouse gases. Each gas is converted using its global warming potential over 100 years: methane traps about 27–30 times as much heat as CO₂ and nitrous oxide about 273 times. This counter shows CO₂ only; carbon footprints are usually given in CO₂e.
The biggest levers are usually flying less, driving less or switching to an electric car, heating with a heat pump in a well-insulated home, eating less red meat and choosing renewable electricity. Estimate your footprint in two minutes or see 15 ways to cut it, ranked.
No. No instrument measures the world’s emissions in real time. The counter spreads the Global Carbon Budget’s annual estimate evenly across the year, so it shows the expected running total, not a measurement. Fossil CO₂ estimates are accurate to about ±5%; land-use emissions are much less certain. How the counter works. Some emissions can be tracked in real time, such as electricity grids and large power plants: see real-time carbon tracking.
The counter ticks every second, and the figures behind it are updated once a year when the Global Carbon Budget is published, usually in November. Country data comes from Our World in Data and is refreshed at the same time.
Carbon Emissions Counter turns the world’s most trusted emissions data into numbers you can see change. It is independent, free, has no ads and sets no cookies. More about us →
Global totals and the carbon budget come from the Global Carbon Budget 2025, the annual assessment by more than 100 scientists. Country figures come from Our World in Data, which publishes the same Global Carbon Project data.
Annual totals are spread evenly over the year, so the counter shows an estimate, not a live measurement. The full method, assumptions and uncertainties are on how the counter works.
Once a year, when the new Global Carbon Budget is published, usually in November. Current figures: Global Carbon Budget 2025 and country data for 2024.
Free to use with a link. Students, teachers and journalists: copy a citation, add the live counter widget to your own site, or download the data and charts.
Carbon Emissions Counter (2026). Carbon Emissions Counter Live: real-time global CO₂ emissions. Based on Global Carbon Budget 2025. https://www.carbonemissionscounter.com/