Climate science
CO₂ in the atmosphere: today’s ppm level and why it keeps rising
Carbon dioxide in the air passed 432 parts per million at Mauna Loa in May 2026, more than 50% above pre-industrial levels. Here is what the numbers mean, where they come from and why they keep climbing.
What is the CO₂ level today?
The monthly average at Mauna Loa Observatory in Hawaii was 426.07 ppm in September 2026, according to NOAA’s preliminary data. That is near the yearly low and about 1.7 ppm above September 2025. The peak came in May 2026 at a record 432.3 ppm (NOAA), or 432.0 ppm in the separate Scripps record at the same site. Both are about 1.8 ppm higher than May 2025.
For whole years, NOAA’s Mauna Loa average was 427.35 ppm in 2025, and its global average over marine surface sites was 425.62 ppm. The Global Carbon Budget 2025, which the rest of this site uses, put the 2025 global mean at about 425.7 ppm, up from 422.8 ppm in 2024 and 52% above the pre-industrial level. The IPCC concluded that CO₂ is now higher than at any time in at least 2 million years.
What does ppm mean?
“Parts per million” is a count of molecules. A concentration of 427 ppm means that out of every million molecules of dry air, about 427 are carbon dioxide. That is 0.0427% of the atmosphere. NOAA reports it as a dry-air mole fraction, meaning water vapour is removed before measuring, so humid and dry days can be compared.
CO₂ is a small share of the air, but it absorbs heat radiated by the Earth’s surface. A small change in a trace gas therefore has a large effect on the energy balance, which is why scientists track it to two decimal places.
A useful conversion: 1 ppm of CO₂ in the global atmosphere corresponds to about 2.124 billion tonnes of carbon, or roughly 7.8 billion tonnes of CO₂ (the factor used by the Global Carbon Budget).
Mauna Loa or global average: which number should you use?
You will see two kinds of figures quoted, and they are both correct:
- Mauna Loa (single station). Measured continuously since 1958, first by Charles David Keeling of the Scripps Institution of Oceanography and, since 1974, also by NOAA. The site sits high on a volcano in the Pacific, far from local pollution. This is the record most news stories quote, and Scripps and NOAA publish separate, slightly different values from it.
- Global average. NOAA combines air samples from a network of remote marine sites in both hemispheres, starting in 1979. The Global Carbon Budget uses this series.
Mauna Loa typically reads 1 to 2 ppm higher because most fossil CO₂ is emitted in the Northern Hemisphere and it takes about a year for air to mix across the equator. In 2025 the gap was 1.7 ppm (427.35 against 425.62 ppm).
The Keeling curve and its seasonal cycle
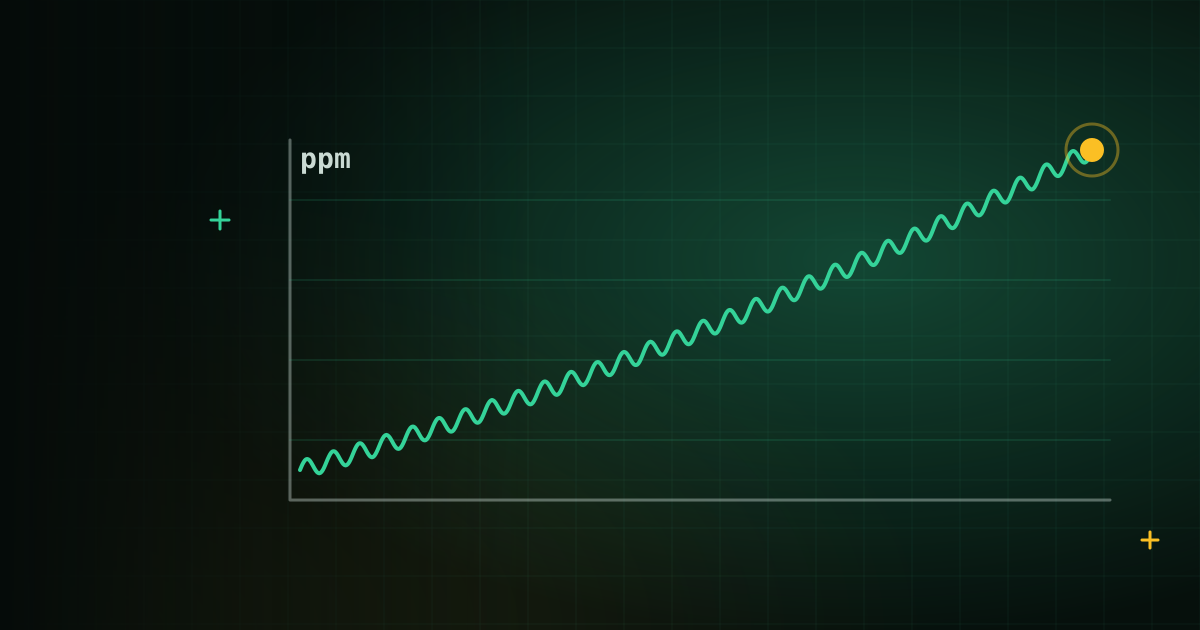
Plotted month by month, the Mauna Loa record is known as the Keeling curve: a steady upward climb with a regular sawtooth on top. The sawtooth is the Northern Hemisphere’s vegetation breathing. Plants take up CO₂ as they grow in spring and summer, so concentrations fall from a peak in May to a low in September or October. In autumn and winter, decaying leaves and soils release CO₂ again.
At Mauna Loa the swing is about 6 ppm: in 2025 the monthly mean went from 430.51 ppm in May to 424.37 ppm in September. That is why monthly figures should always be compared with the same month a year earlier, not with the previous month.
| Year | Mauna Loa (ppm) | Global average (ppm) |
|---|---|---|
| 1960 | 316.91 | – |
| 1970 | 325.68 | – |
| 1980 | 338.76 | 338.91 |
| 1990 | 354.45 | 354.06 |
| 2000 | 369.71 | 368.96 |
| 2010 | 390.10 | 388.75 |
| 2015 | 401.01 | 399.65 |
| 2020 | 414.21 | 412.44 |
| 2024 | 424.61 | 422.79 |
| 2025 | 427.35 | 425.62 |
Mauna Loa crossed 400 ppm as an annual average in 2015. The rise since 1960 is about 110 ppm, more than half of it since 2000.
How fast is CO₂ rising? Growth rates and recent records
The increase is not only continuing but speeding up. NOAA’s annual growth rates, averaged by decade, show the pace roughly tripling since the 1960s:
| Period | Mauna Loa | Global |
|---|---|---|
| 1960–1969 | 0.86 | – |
| 1980–1989 | 1.61 | 1.58 |
| 2000–2009 | 1.97 | 1.90 |
| 2010–2019 | 2.42 | 2.38 |
| 2016–2025 | 2.56 | 2.53 |
2024 set the record. The global average rose by about 3.75 ppm, the largest one-year increase in NOAA’s record, and Mauna Loa saw its two largest annual increases in 2023 and 2024 (about 3.3 ppm each). Emissions alone did not cause the jump: the 2023–24 El Niño and record heat brought drought and fires that weakened the land’s uptake of CO₂, as in earlier El Niño years such as 1998 and 2016.
In 2025 the increase slowed to about 2.1 ppm globally and 2.2 ppm at Mauna Loa, as El Niño ended and the land sink recovered. These are NOAA’s growth rates, measured from January to December; the gap between the 2024 and 2025 annual averages was larger, about 2.8 ppm, because the year started from a high level. That is a return to the recent trend, not a turning point.
Where does the CO₂ we emit go?
Humans emitted about 42.2 billion tonnes of CO₂ in 2025 from fossil fuels, cement and land-use change, the figure behind our live CO₂ counter. If all of it stayed in the air, concentrations would rise by more than 5 ppm a year. The actual rise is about half that, because nature absorbs the rest.
According to the Global Carbon Budget 2025, over 2015–2024:
- The ocean took up about 29% of human CO₂ emissions. CO₂ dissolves in seawater, which also makes the ocean more acidic. The ocean sink has stagnated since 2016, partly because of the 2023–24 marine heatwaves.
- Land took up about 21%, mostly through plant growth in forests.
- Roughly half stayed in the atmosphere, adding to the concentration.
These sinks are a service we get for free, but they are not guaranteed. Warmer water holds less CO₂, and drought, heat and fire reduce plant uptake, as 2023–24 showed.
Why concentrations rise even if emissions level off
Emissions and concentration are easy to confuse. Emissions are a flow, measured in tonnes per year. Concentration is a stock, the total amount built up in the air. Think of a bath: emissions are the tap, sinks are the drain, and ppm is the water level.
Global fossil CO₂ emissions grew by about 1% in 2025, much more slowly than in the 2000s. But even if they stopped growing entirely, the tap would still be running far faster than the drain, and CO₂ would keep rising by roughly 2 to 2.5 ppm a year. Concentrations stop rising only when emissions fall to about what the sinks remove, which in practice means close to net zero.
You can see this in the long-run data. Annual emissions have risen and fallen with recessions, the 2020 pandemic and energy prices, as the historical CO₂ emissions by country chart shows, but the Keeling curve has gone up every single year since 1958.
How long does CO₂ stay in the atmosphere?
There is no single lifetime, because CO₂ is not destroyed in the air the way methane is. It is moved between air, ocean, plants and rocks at very different speeds. Some is absorbed by the surface ocean and plants within years to decades. Mixing into the deep ocean takes centuries. The last part is removed only by slow chemical weathering of rocks over many thousands of years.
The IPCC estimates that 15 to 40% of the CO₂ emitted stays in the atmosphere for longer than 1,000 years. That is why the warming caused by CO₂ is, on human timescales, close to permanent, and why the total amount ever emitted matters so much.
Is there a safe ppm level for 1.5 °C or 2 °C?
Not as a single CO₂ number. Warming depends on several things a ppm reading does not capture:
- Cumulative emissions. The IPCC found a near-linear relationship: each 1,000 billion tonnes of CO₂ emitted causes about 0.45 °C of warming (likely range 0.27 to 0.63 °C). That is why climate targets are framed as a remaining carbon budget, not a concentration.
- Other gases and aerosols. Methane and nitrous oxide add warming; air pollution particles mask some of it. Two worlds with the same CO₂ can warm by different amounts.
- Time lags. The climate takes time to respond, and the ocean and land sinks change as the world warms.
Numbers such as 350 ppm or 450 ppm still circulate. The IPCC’s 2014 synthesis report linked a likely chance of staying below 2 °C to about 450 ppm CO₂-equivalent in 2100, a measure that combines all greenhouse gases and aerosols. It is not the same as 450 ppm of CO₂, and it is not a level to aim for and hold.
Where to check the latest figure yourself
- NOAA Global Monitoring Laboratory (gml.noaa.gov/ccgg/trends) updates Mauna Loa and global monthly means early each month. The most recent year is marked preliminary and may change slightly.
- Scripps CO₂ Program (keelingcurve.ucsd.edu) publishes daily Mauna Loa readings and its own monthly record, which differs from NOAA’s by a few tenths of a ppm.
- Global Carbon Budget (globalcarbonbudget.org) publishes the annual global picture each November, including emissions, sinks and the remaining budget.
For what these trends mean for the coming years, see our climate outlook for 2026.
Questions and answers
What is the current CO₂ level in ppm?
NOAA’s monthly mean at Mauna Loa, Hawaii, was 426.07 ppm in September 2026 (preliminary data), near the yearly low and about 1.7 ppm above September 2025. The yearly peak came in May 2026 at 432.3 ppm. The global average for 2025 was about 425.6 to 425.7 ppm.
What was CO₂ ppm before the industrial revolution?
About 278 ppm around 1750, according to ice-core records used by the IPCC and the Global Carbon Budget. It is often rounded to 280 ppm. Today’s level is more than 50% higher and the highest in at least 2 million years.
Why is Mauna Loa CO₂ higher than the global average?
Mauna Loa is in the Northern Hemisphere, where most fossil CO₂ is emitted, and it takes about a year for air to mix between the hemispheres. The global average also includes Southern Hemisphere sites, so it typically runs 1 to 2 ppm lower. In 2025 Mauna Loa averaged 427.35 ppm and NOAA’s global mean was 425.62 ppm.
How fast is CO₂ increasing each year?
Over the past ten years (2016–2025) the average increase has been about 2.5 ppm a year, both at Mauna Loa and globally. The record was 2024, when the global average rose by about 3.8 ppm. In 2025 the rise slowed to about 2.1 ppm globally as El Niño faded.
Would CO₂ levels fall if emissions stopped?
Yes, but slowly. The ocean and land would keep absorbing CO₂, so concentrations would start to decline. The IPCC estimates that 15 to 40% of emitted CO₂ stays in the atmosphere for longer than 1,000 years, so levels would stay well above pre-industrial for many centuries.
Sources
- Trends in Atmospheric Carbon Dioxide (Mauna Loa monthly and annual means, growth rates), NOAA Global Monitoring Laboratory, data updated October 2026
- Trends in Atmospheric Carbon Dioxide: global monthly and annual means, NOAA Global Monitoring Laboratory, 2026
- Growth rates of atmospheric CO₂ (Mauna Loa and global), NOAA Global Monitoring Laboratory, 2026
- Annual Carbon Dioxide Peak Reaches 432 Parts per Million, Scripps Institution of Oceanography, June 2026
- The Keeling Curve, Scripps CO₂ Program, UC San Diego
- Climate change: atmospheric carbon dioxide, NOAA Climate.gov, 2025
- Global Carbon Budget 2025, Friedlingstein et al., Earth System Science Data, 2026
- Fossil fuel CO₂ emissions hit record high in 2025, Global Carbon Project, 2025
- Climate Change 2021: The Physical Science Basis, Summary for Policymakers, IPCC AR6 Working Group I, 2021
- Climate Change 2013: The Physical Science Basis, Chapter 6: Carbon and other biogeochemical cycles, IPCC AR5 Working Group I, 2013
- Climate Change 2014: Synthesis Report, Summary for Policymakers, IPCC AR5, 2014


